DATA VISUALISATION RESOURCES

This is a collection of some of the many data visualisation (and related) tools, applications, toolkits, libraries, platforms, and packages.
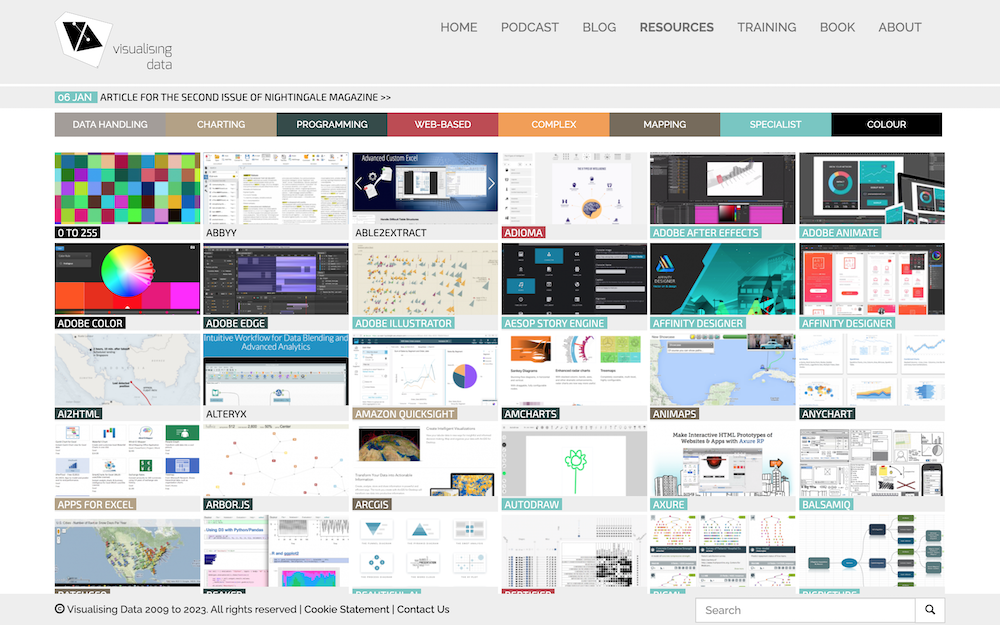
Organised loosely around several categories, based on the best-fit descriptive characteristic or primary purpose, this collection has been curated since around 2010 to provide readers with as current and as comprehensive a view as possible of the visualisation technology landscape. The featured image above is a screenshot of the previous iteration of this resources catalogue, which was the most popular page on this website for many years.
The entries listed below are organised within each category alphabetically. The thumbnail images are manually prepared, which means some may be a little outdated but their role is largely decorative/indicative. Click on the tiles to visit the vendor or associated website, you can also access a read-only Google Sheets dataset presenting the same list of contents.
There are no affiliate links or commercial influences on any inclusions, every item included has been demonstrated to be useful to someone, somewhere, at some point. Some references listed may now be discontinued, obsolete, or no longer supported, but they are included because they may still be useful for somebody in the form they exist today.
Suggestions for additional tools, edits of existing ones, and deletions of obsolete or acquired tools are always welcome. Reasonable updates will be applied as often as possible.
To learn more about the chart-making capabilities of a selection of the most common of these tools, please visit the Chartmaker Directory.
CHARTING
This is a collection of tools and applications for creating charts, visually exploring data and in some cases developing interactive solutions through no-code/low-code platforms.
CODING
This is a collection of libraries, frameworks, toolkits, and environments used for programmatically developing charts and dynamic visualisations.
COMPLEX
This is a collection of resources for handling more complex visualisation tasks involving multivariate and/or qualitative material.
MAPPING
This is a collection of packages, utilities, and libraries for mapping data and performing spatial analysis.
DATA
This is a collection of applications used for the collecting, handling, integrating, and transforming of data.
COLOUR
This is a collection of tools for generating and editing colour palettes, as well as practical, theoretical, and inspirational sources of guidance.
SPECIALIST
This is a collection of design, presentation, publishing and niche resources that enhance the visualisation development workflow.
