
I’m delighted to launch the latest episode in the third season of Explore Explain, a long-form video and podcast series about data visualisation design.
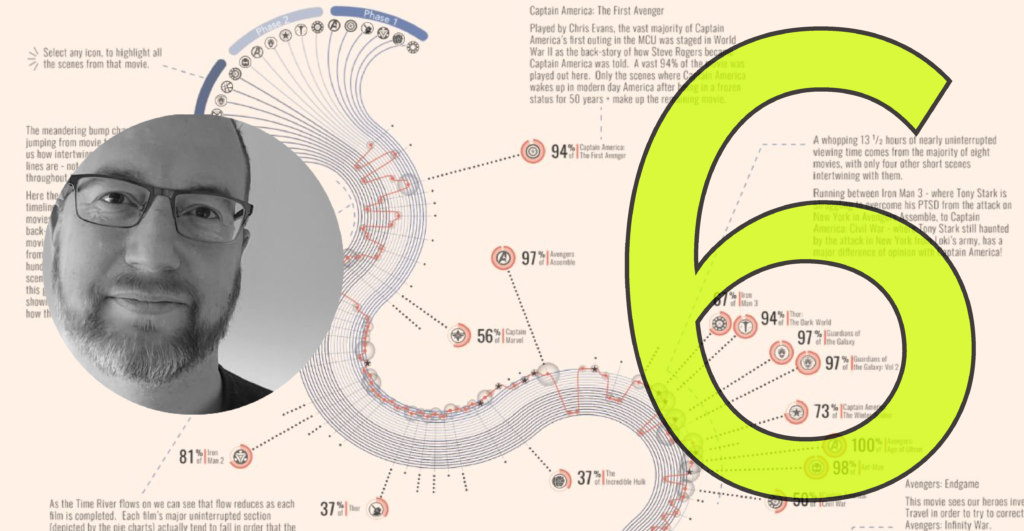
For this sixth episode it was a pleasure to welcome Sam Parsons, Senior Analytics Consultant with Biztory. We had a detailed conversation about the data and design story behind Sam’s visualisation ‘Rivers of Time‘, a vast visual study of time in the Marvel Cinematic Universe.
To find out more information about how to listen, view and subscribe to the audio and video versions of this episode, and to view the full list episodes, visit the podcast page.
Video Conversation
You can watch this episode on the dedicated Explore Explain Youtube channel or through using the embedded player below.
You can also watch a short highlights package of this episode, focusing on five key insights to emerge from the conversation. This video is on the same Explore Explain Youtube channel or through using the embedded player below.
Audio Conversation
The audio podcast is published across all common platforms (such as Apple, Acast, Spotify etc.), which means you will find this series listed in the respective directories through a simple search for ‘Explore Explain’ or by manually entering – or copying/pasting – this url to your subscriptions – https://feed.pod.co/exploreexplain.
To listen directly, visit this link or use the embedded podcast player below.
Here are further links to some of the key resources mentioned during this episode:
