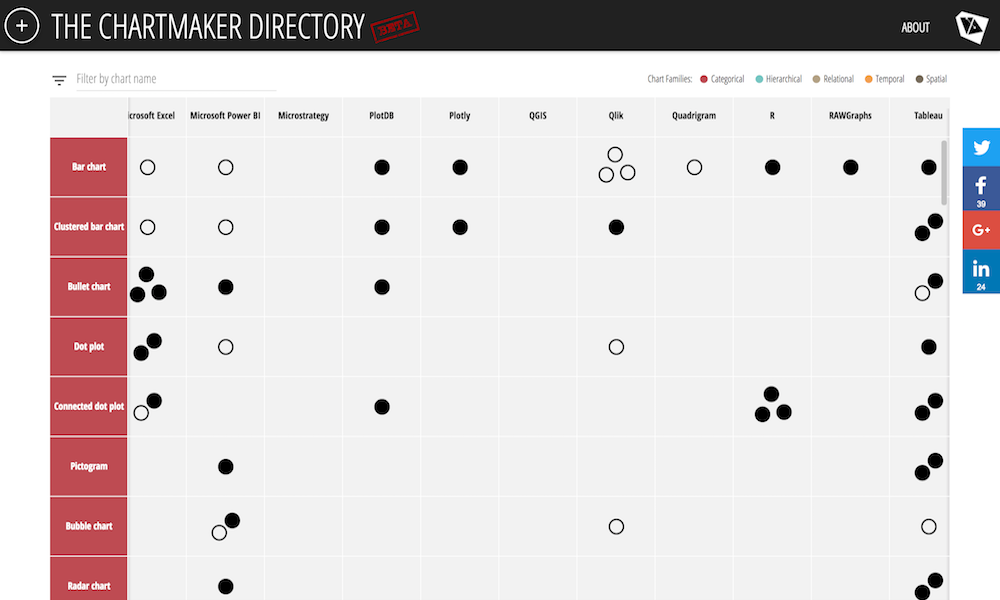
Last week I launched the Chartmaker Directory, an attempt to gather and organise a useful catalogue of references that will offer a good sense of what charts can be made using which tools and, where necessary, how. I wanted to provide a brief update on the status of things 10 days on.
532 REFERENCES!: The main update concerns the quantity of submissions that have been received, helping to grow the foundation of references I began with to now reach a total of 532 links to useful demonstrations of the capabilities of the tools included. Thank you so much to all contributors who have supported this endeavour by submitting suggested references. As the quantities continue to grow I would urge focus towards the gaps in each column, which might represent missing references for tools that are actually able to create a given chart.
SOLUTIONS: The biggest change I have made to the site concerns the simple rewording of ‘tutorial’, as one of the reference types, alongside ‘example’. I was always clear that an ‘example’ would relate to references that simply show a chart can be made, which might just be a link pointing towards an image of a chart. ‘Tutorial’, by contrast, were intended to represent those references that provide a bit more assistance guiding readers towards a solution. It quickly became clear that ‘how-to’ references weren’t the only way to offer this kind of assistance: you might have video demonstrations, downloadable workbooks or code that one can utilise. I have therefore changed the ‘tutorial’ category to ‘solution’, which feels a better fit. I will at some point go back through the collection to ensure the distinction has been correctly applied.
TOOLS: The tools included have evolved during the past week. I have added several tools that I neglected to include or were not even previously aware of. A couple have been removed because they may not be explicitly chart making tools – even though they still have a valuable role to play in creating a visualisation – and some have been consolidated to fall under a general tool ‘family’ heading as a pragmatic home (eg. Qlik is all Qlik products, same with Tableau, R is now R and all related packages and extensions).
FEEDBACK: As a beta release I have been welcoming of feedback and suggestions for improvements on the site. These have been collected and will be considered for progressing the development in both the immediate and longer term. Some ideas proposed would be nice to incorporate but might just be beyond scope or capacity, realistically speaking.
What’s that, you want some charts? OK, why not…
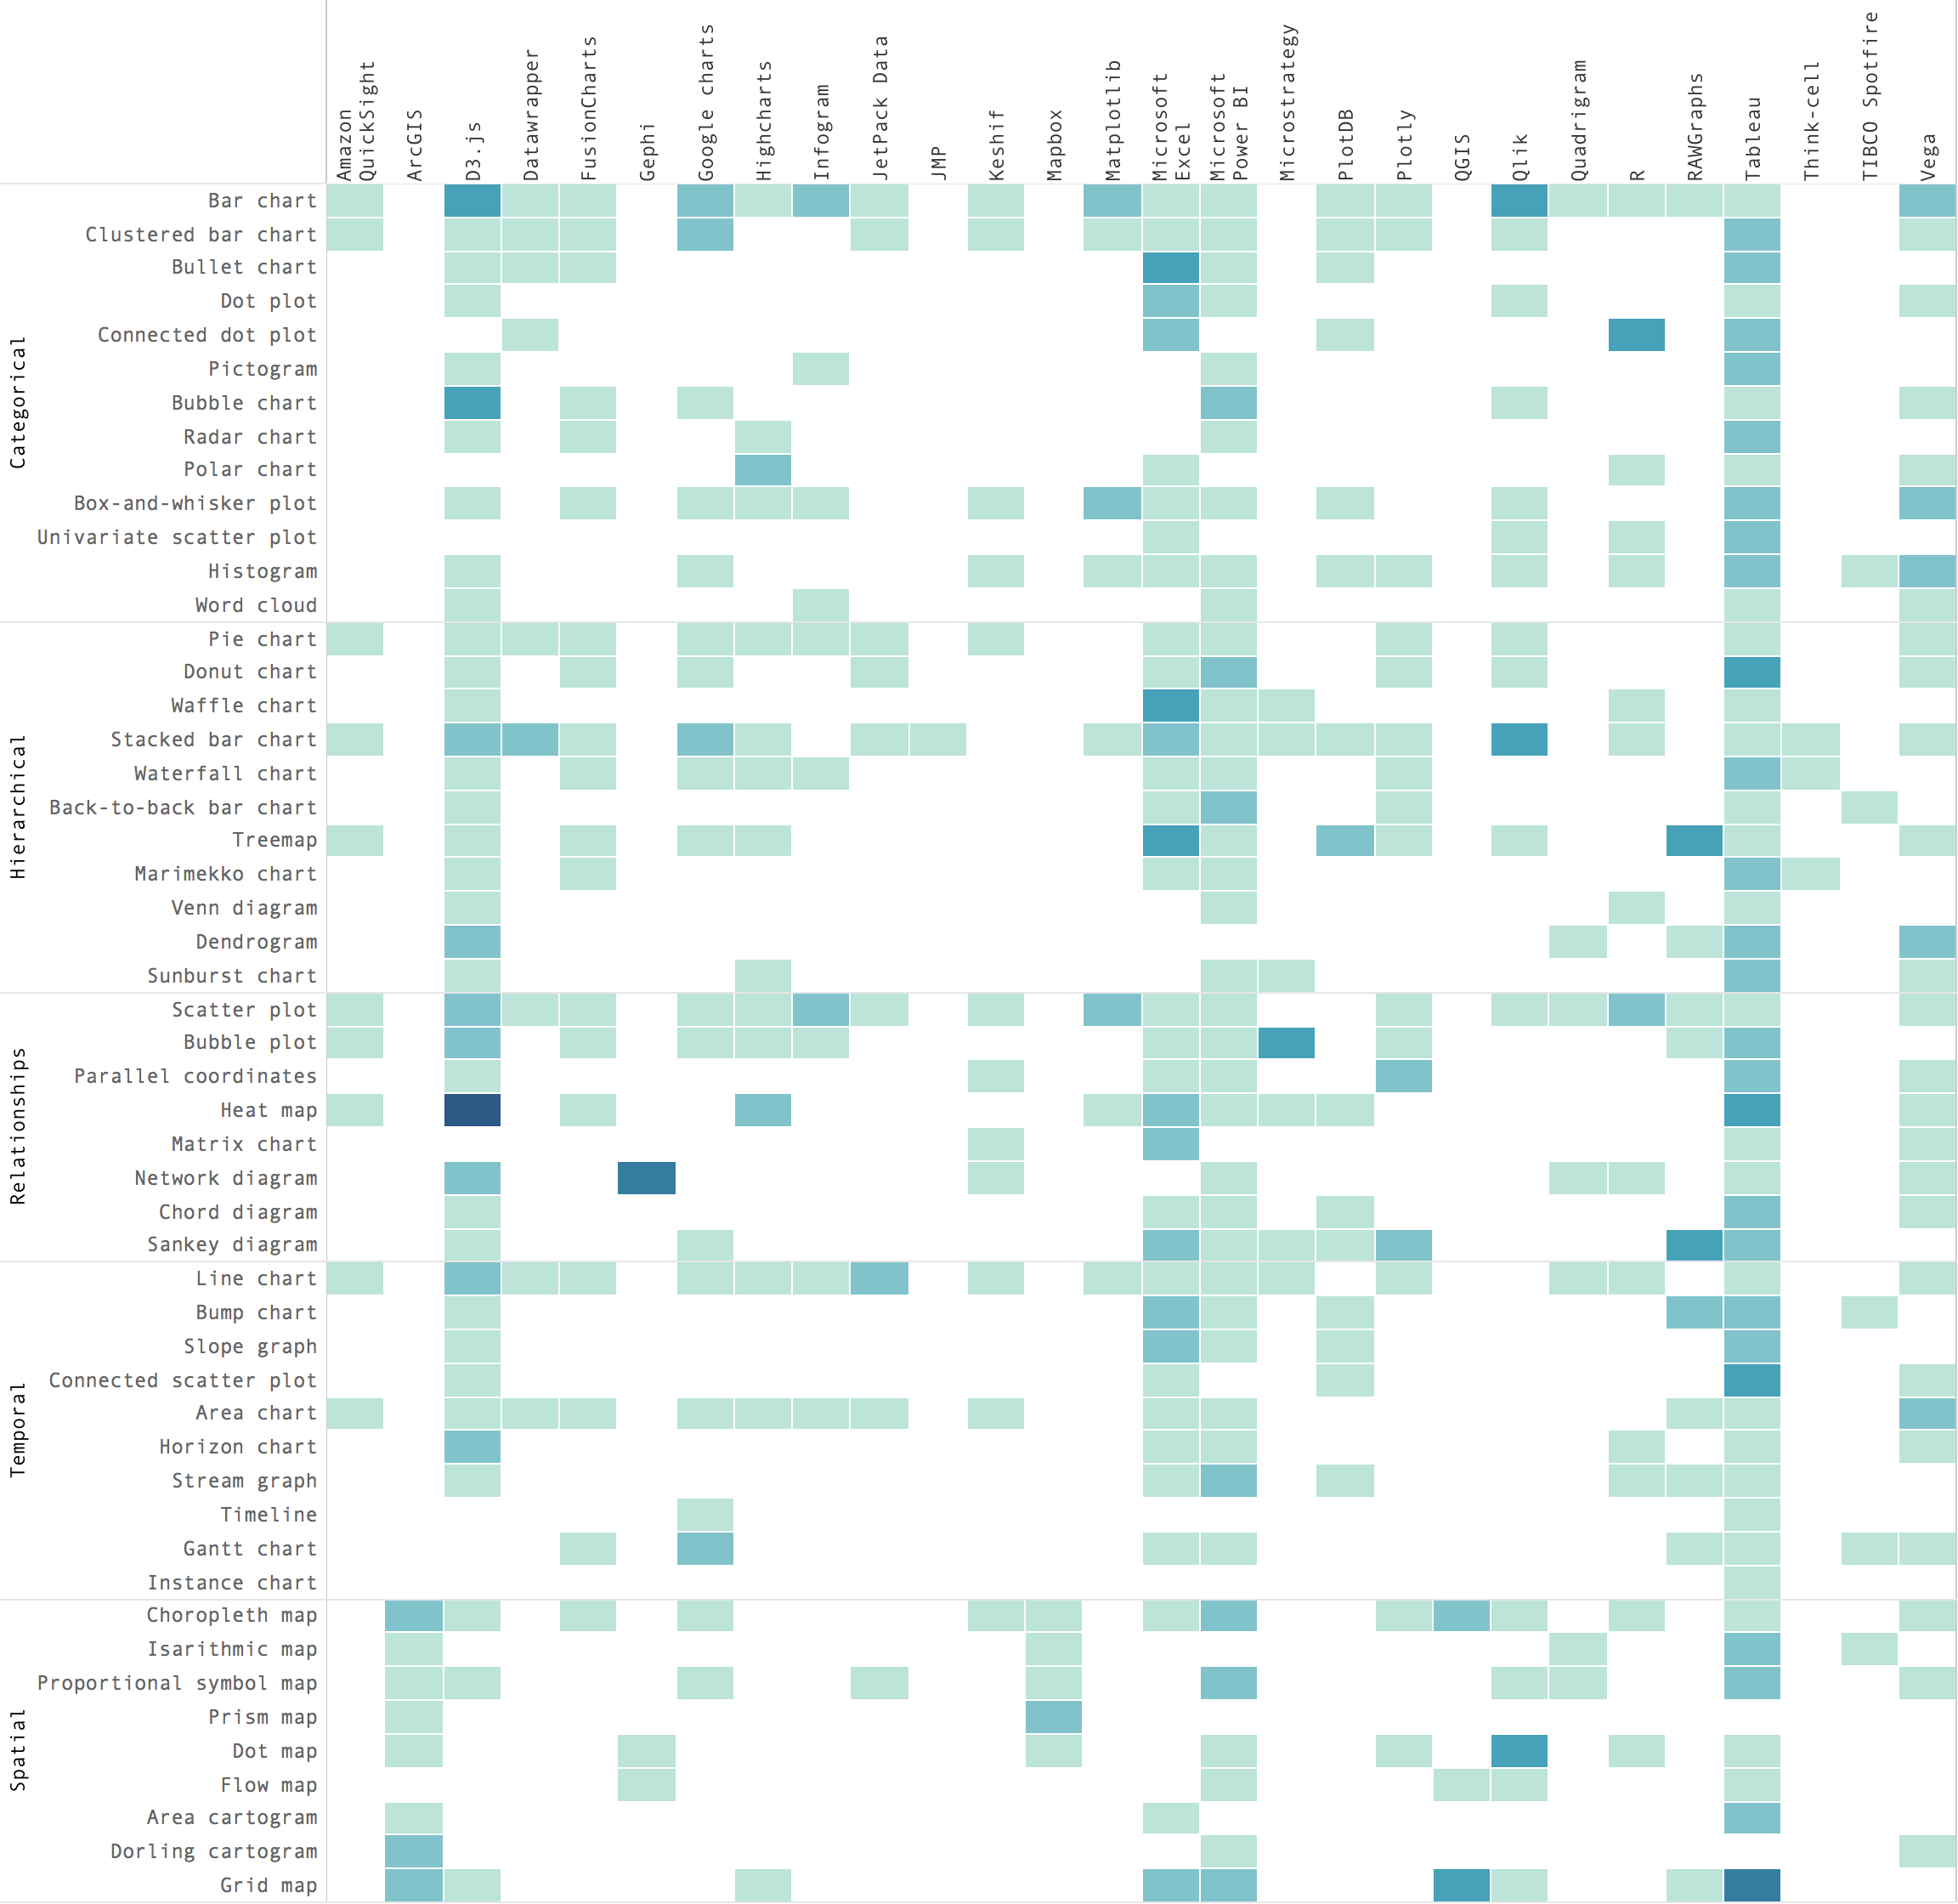
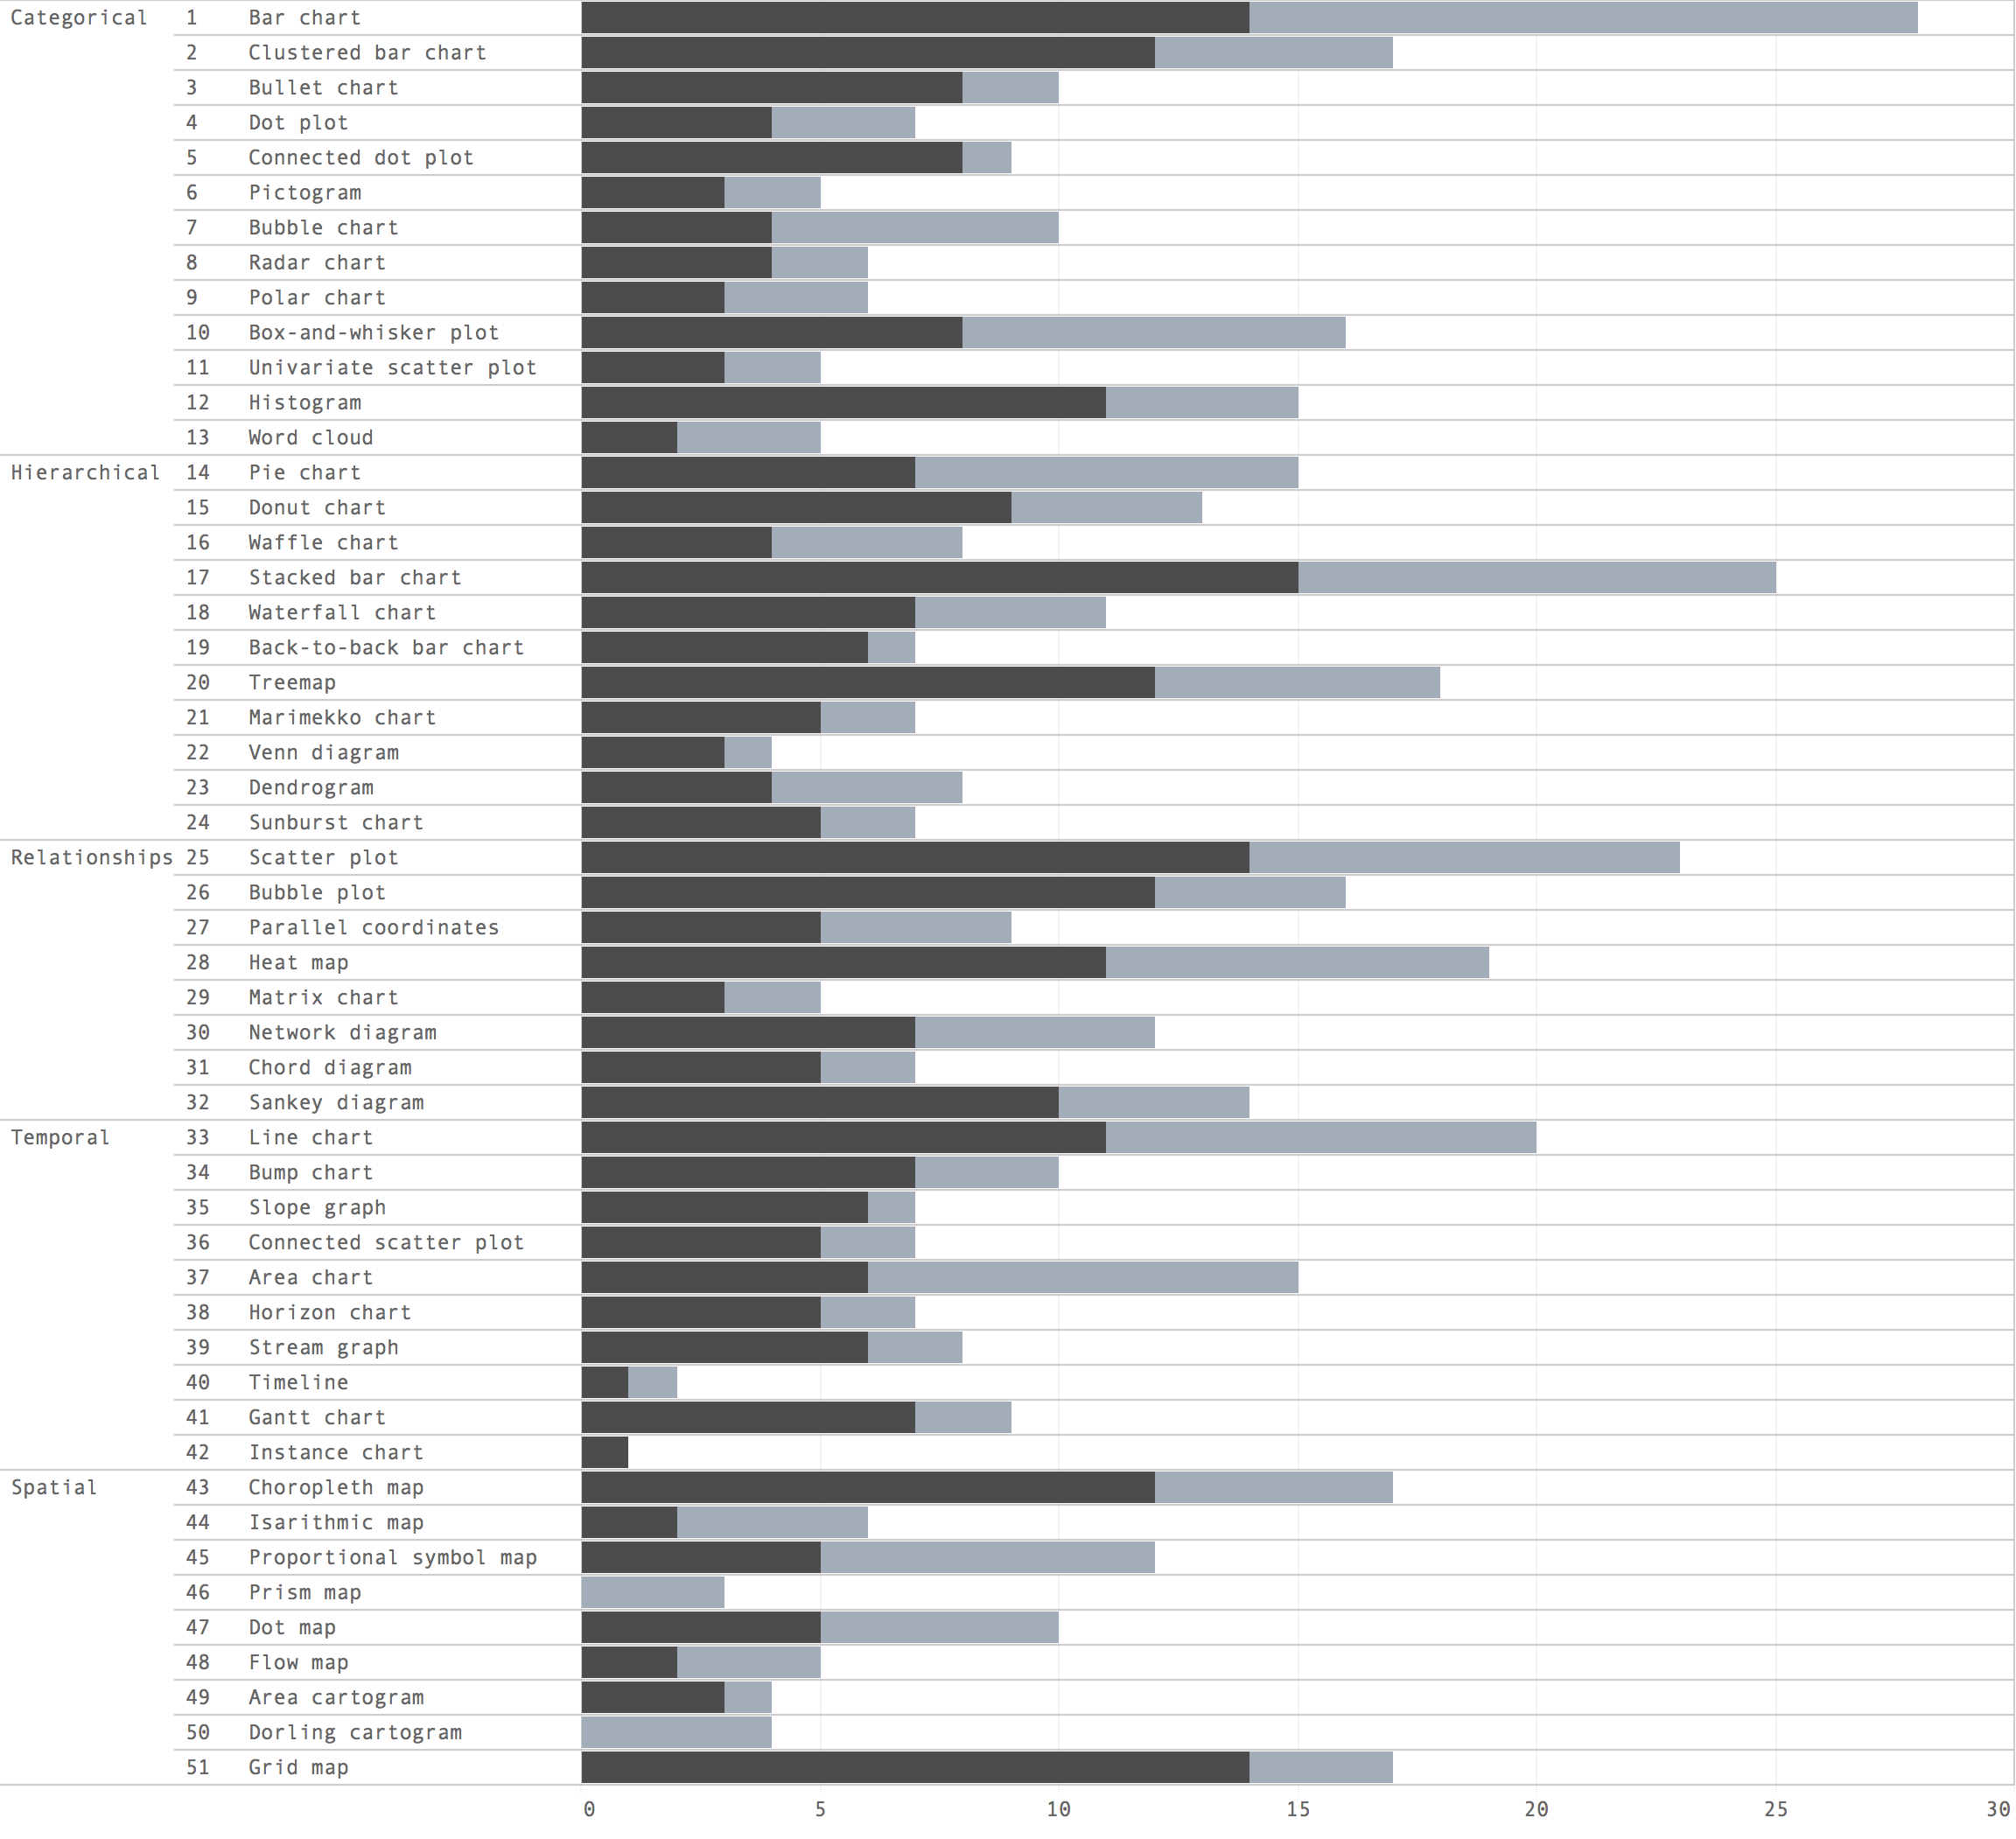
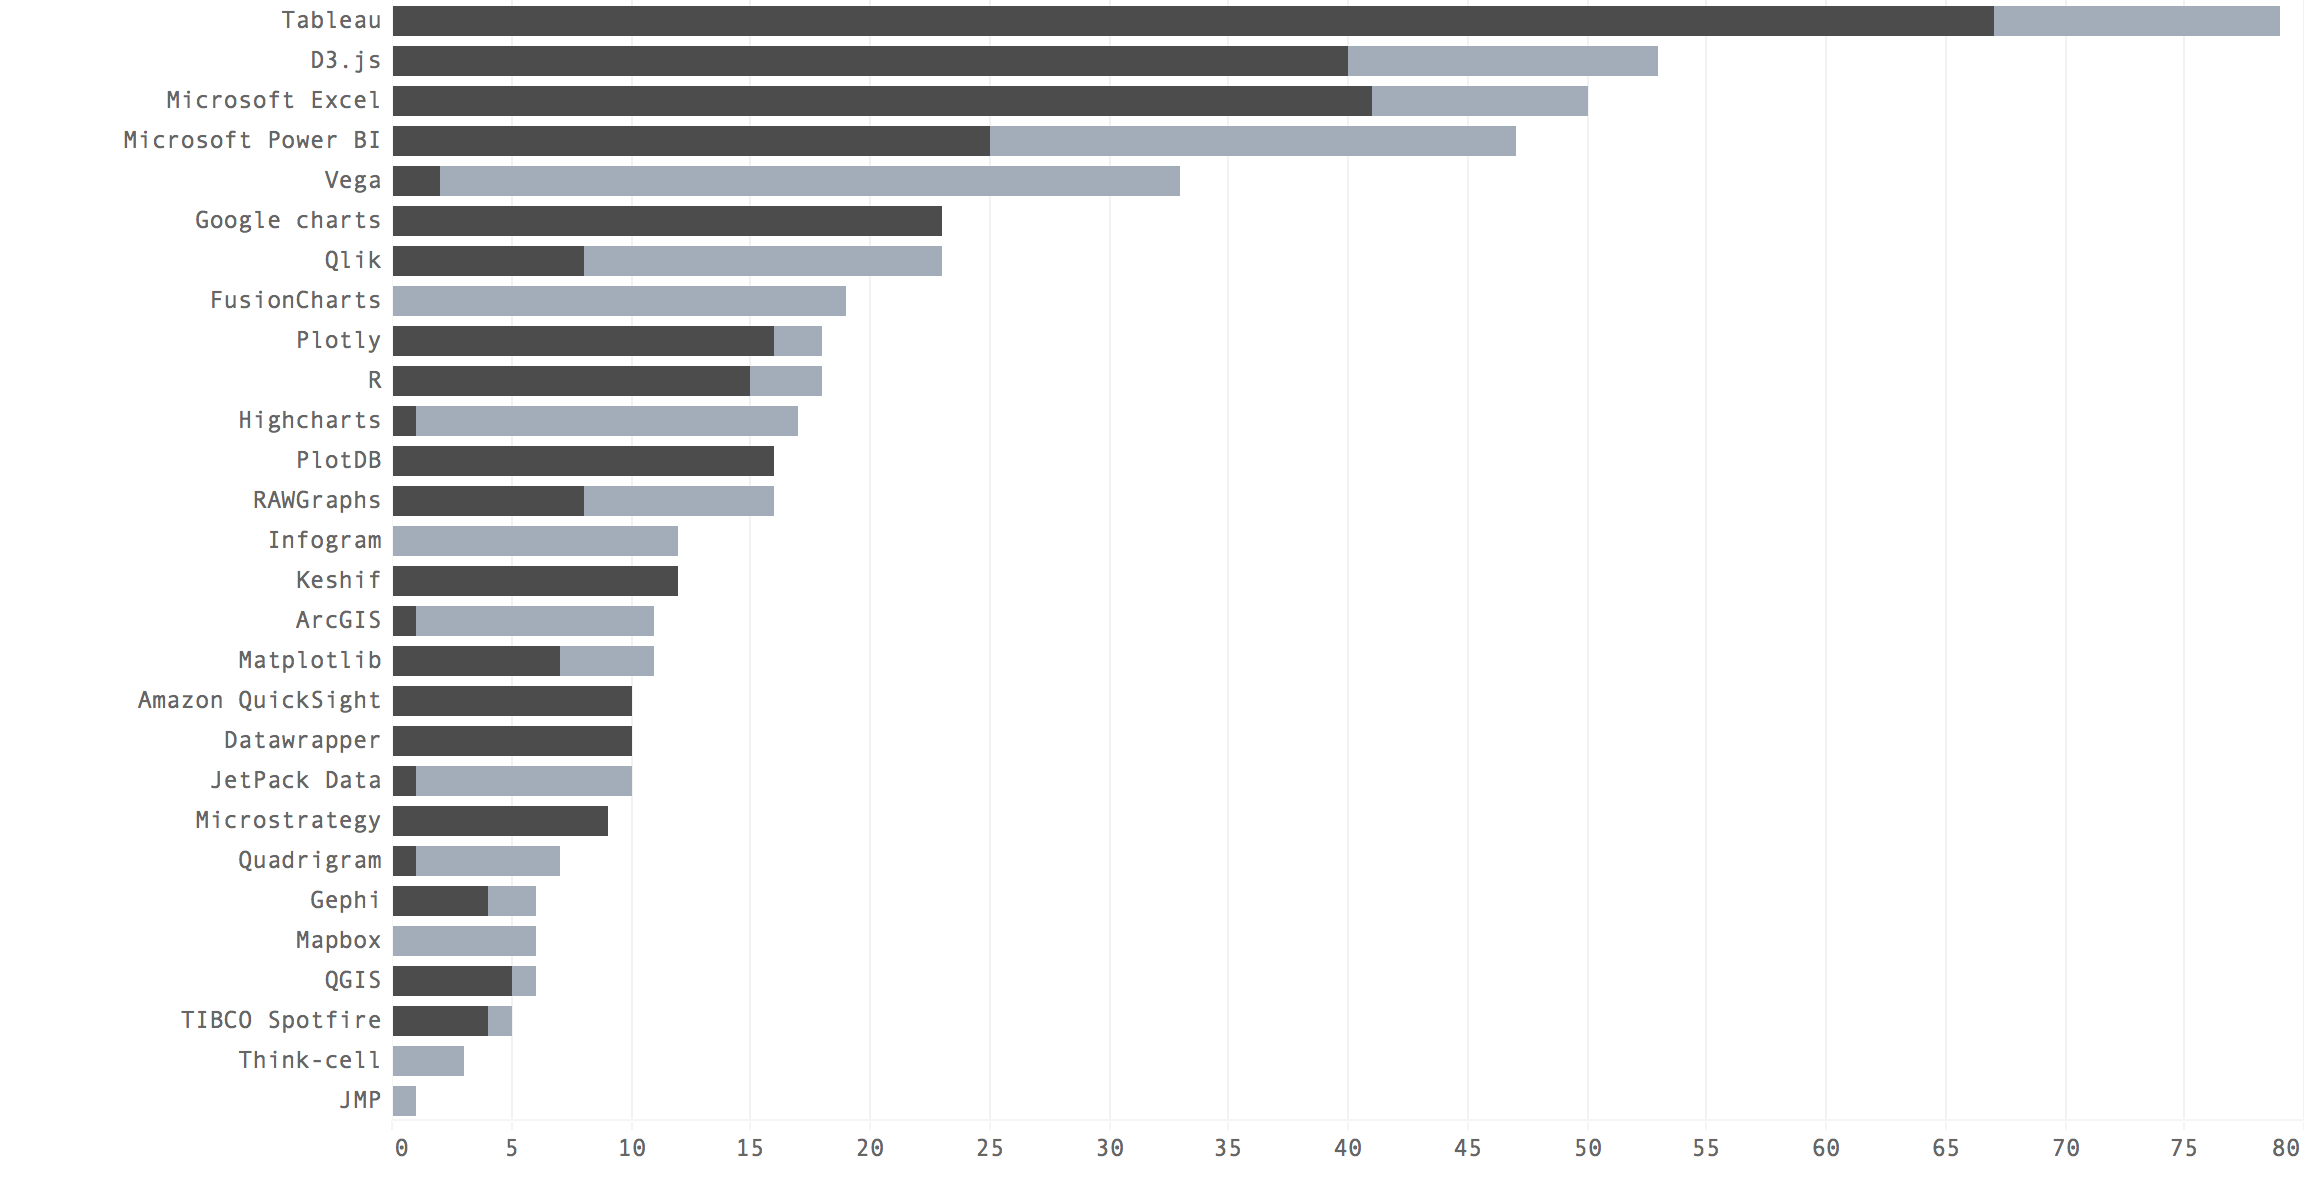
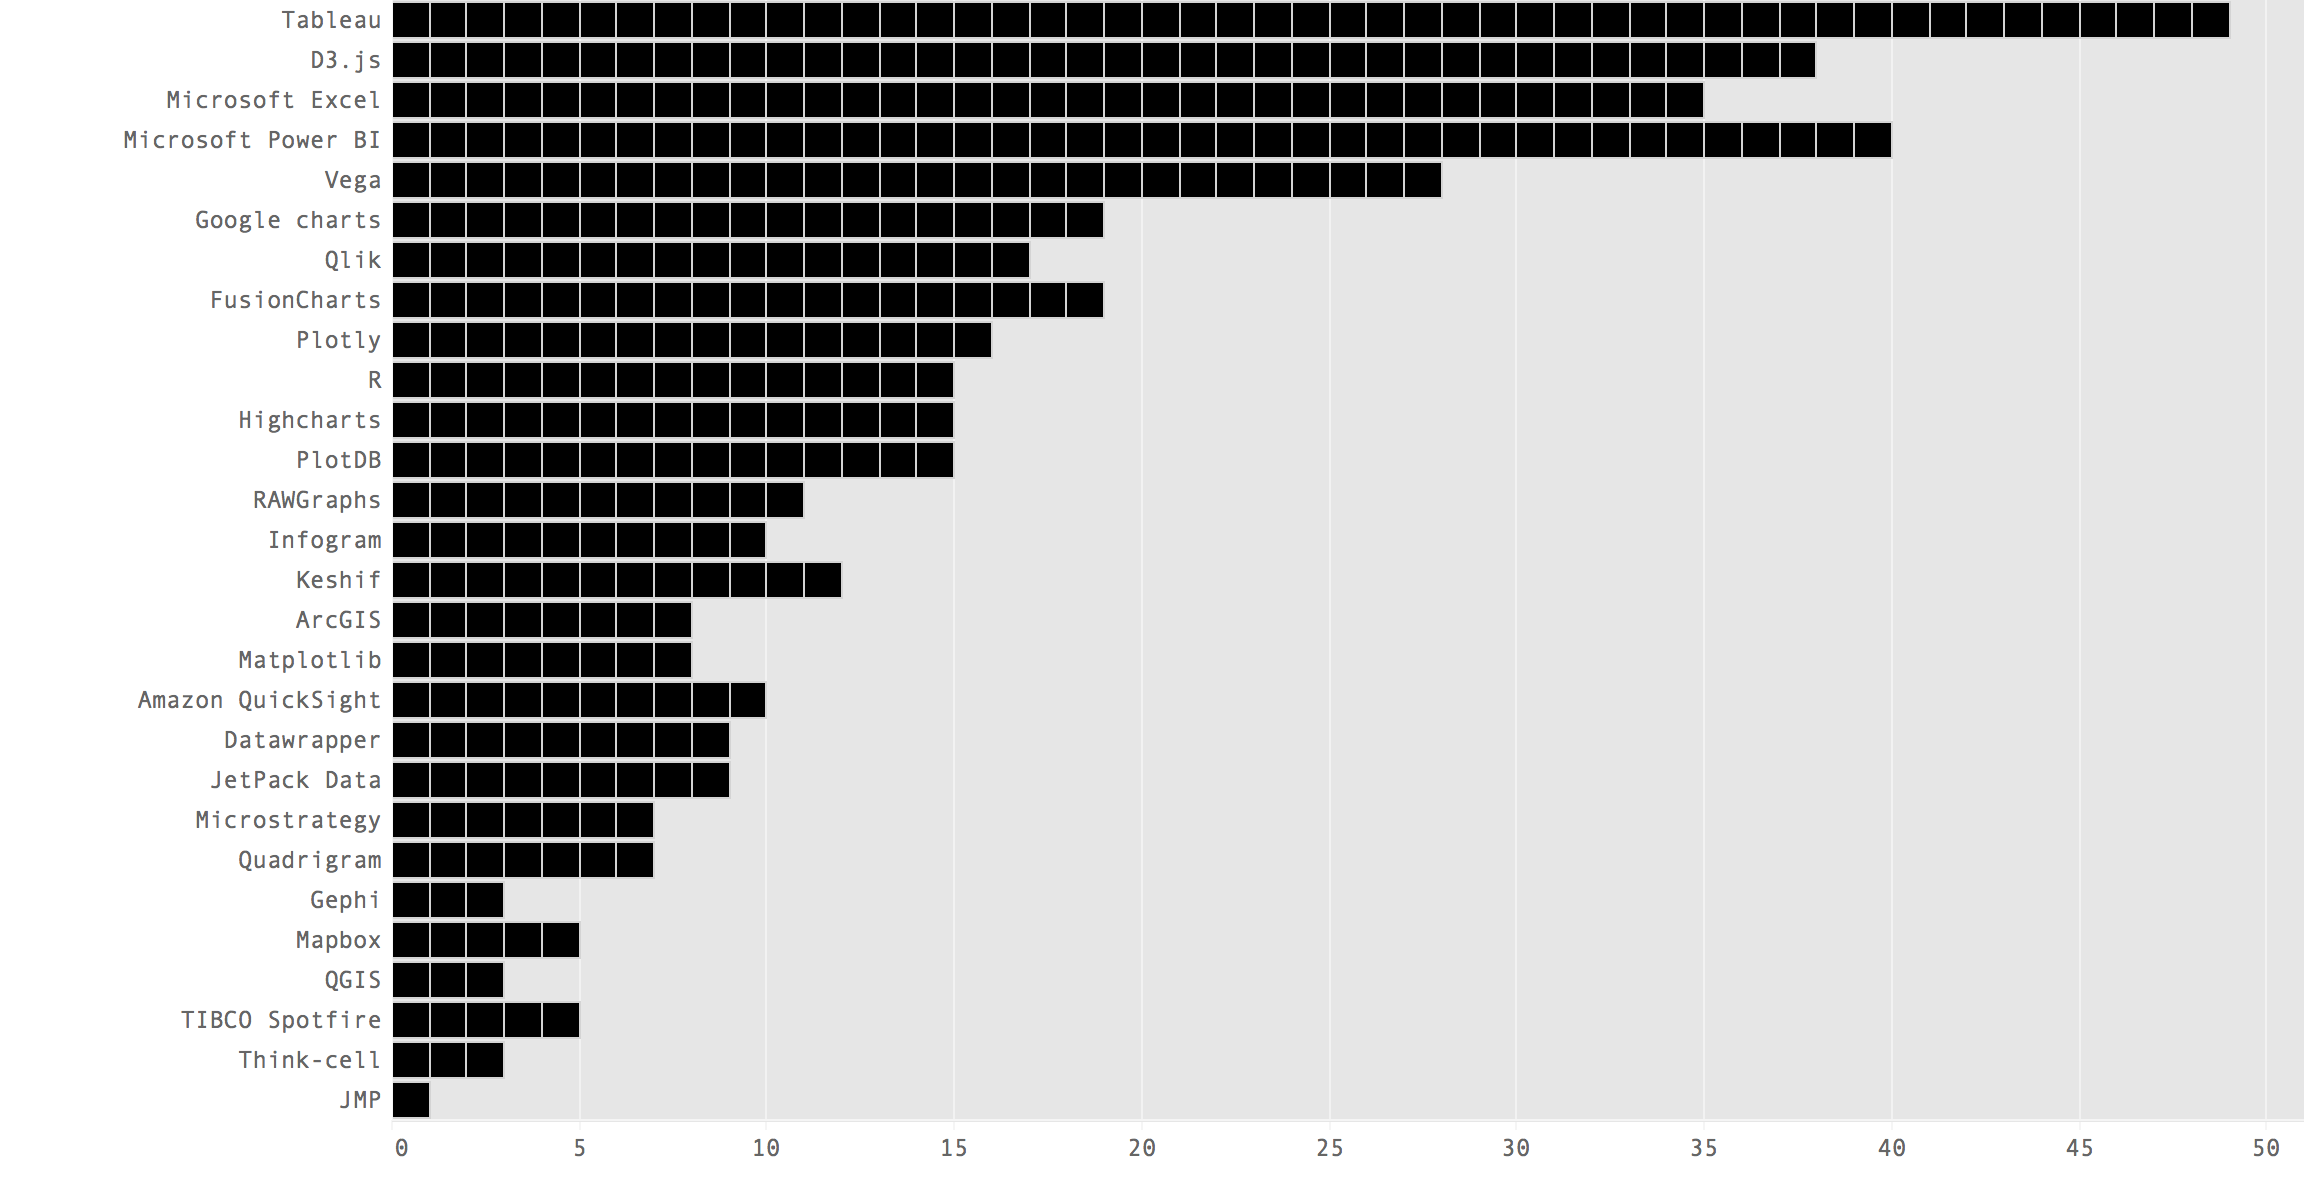
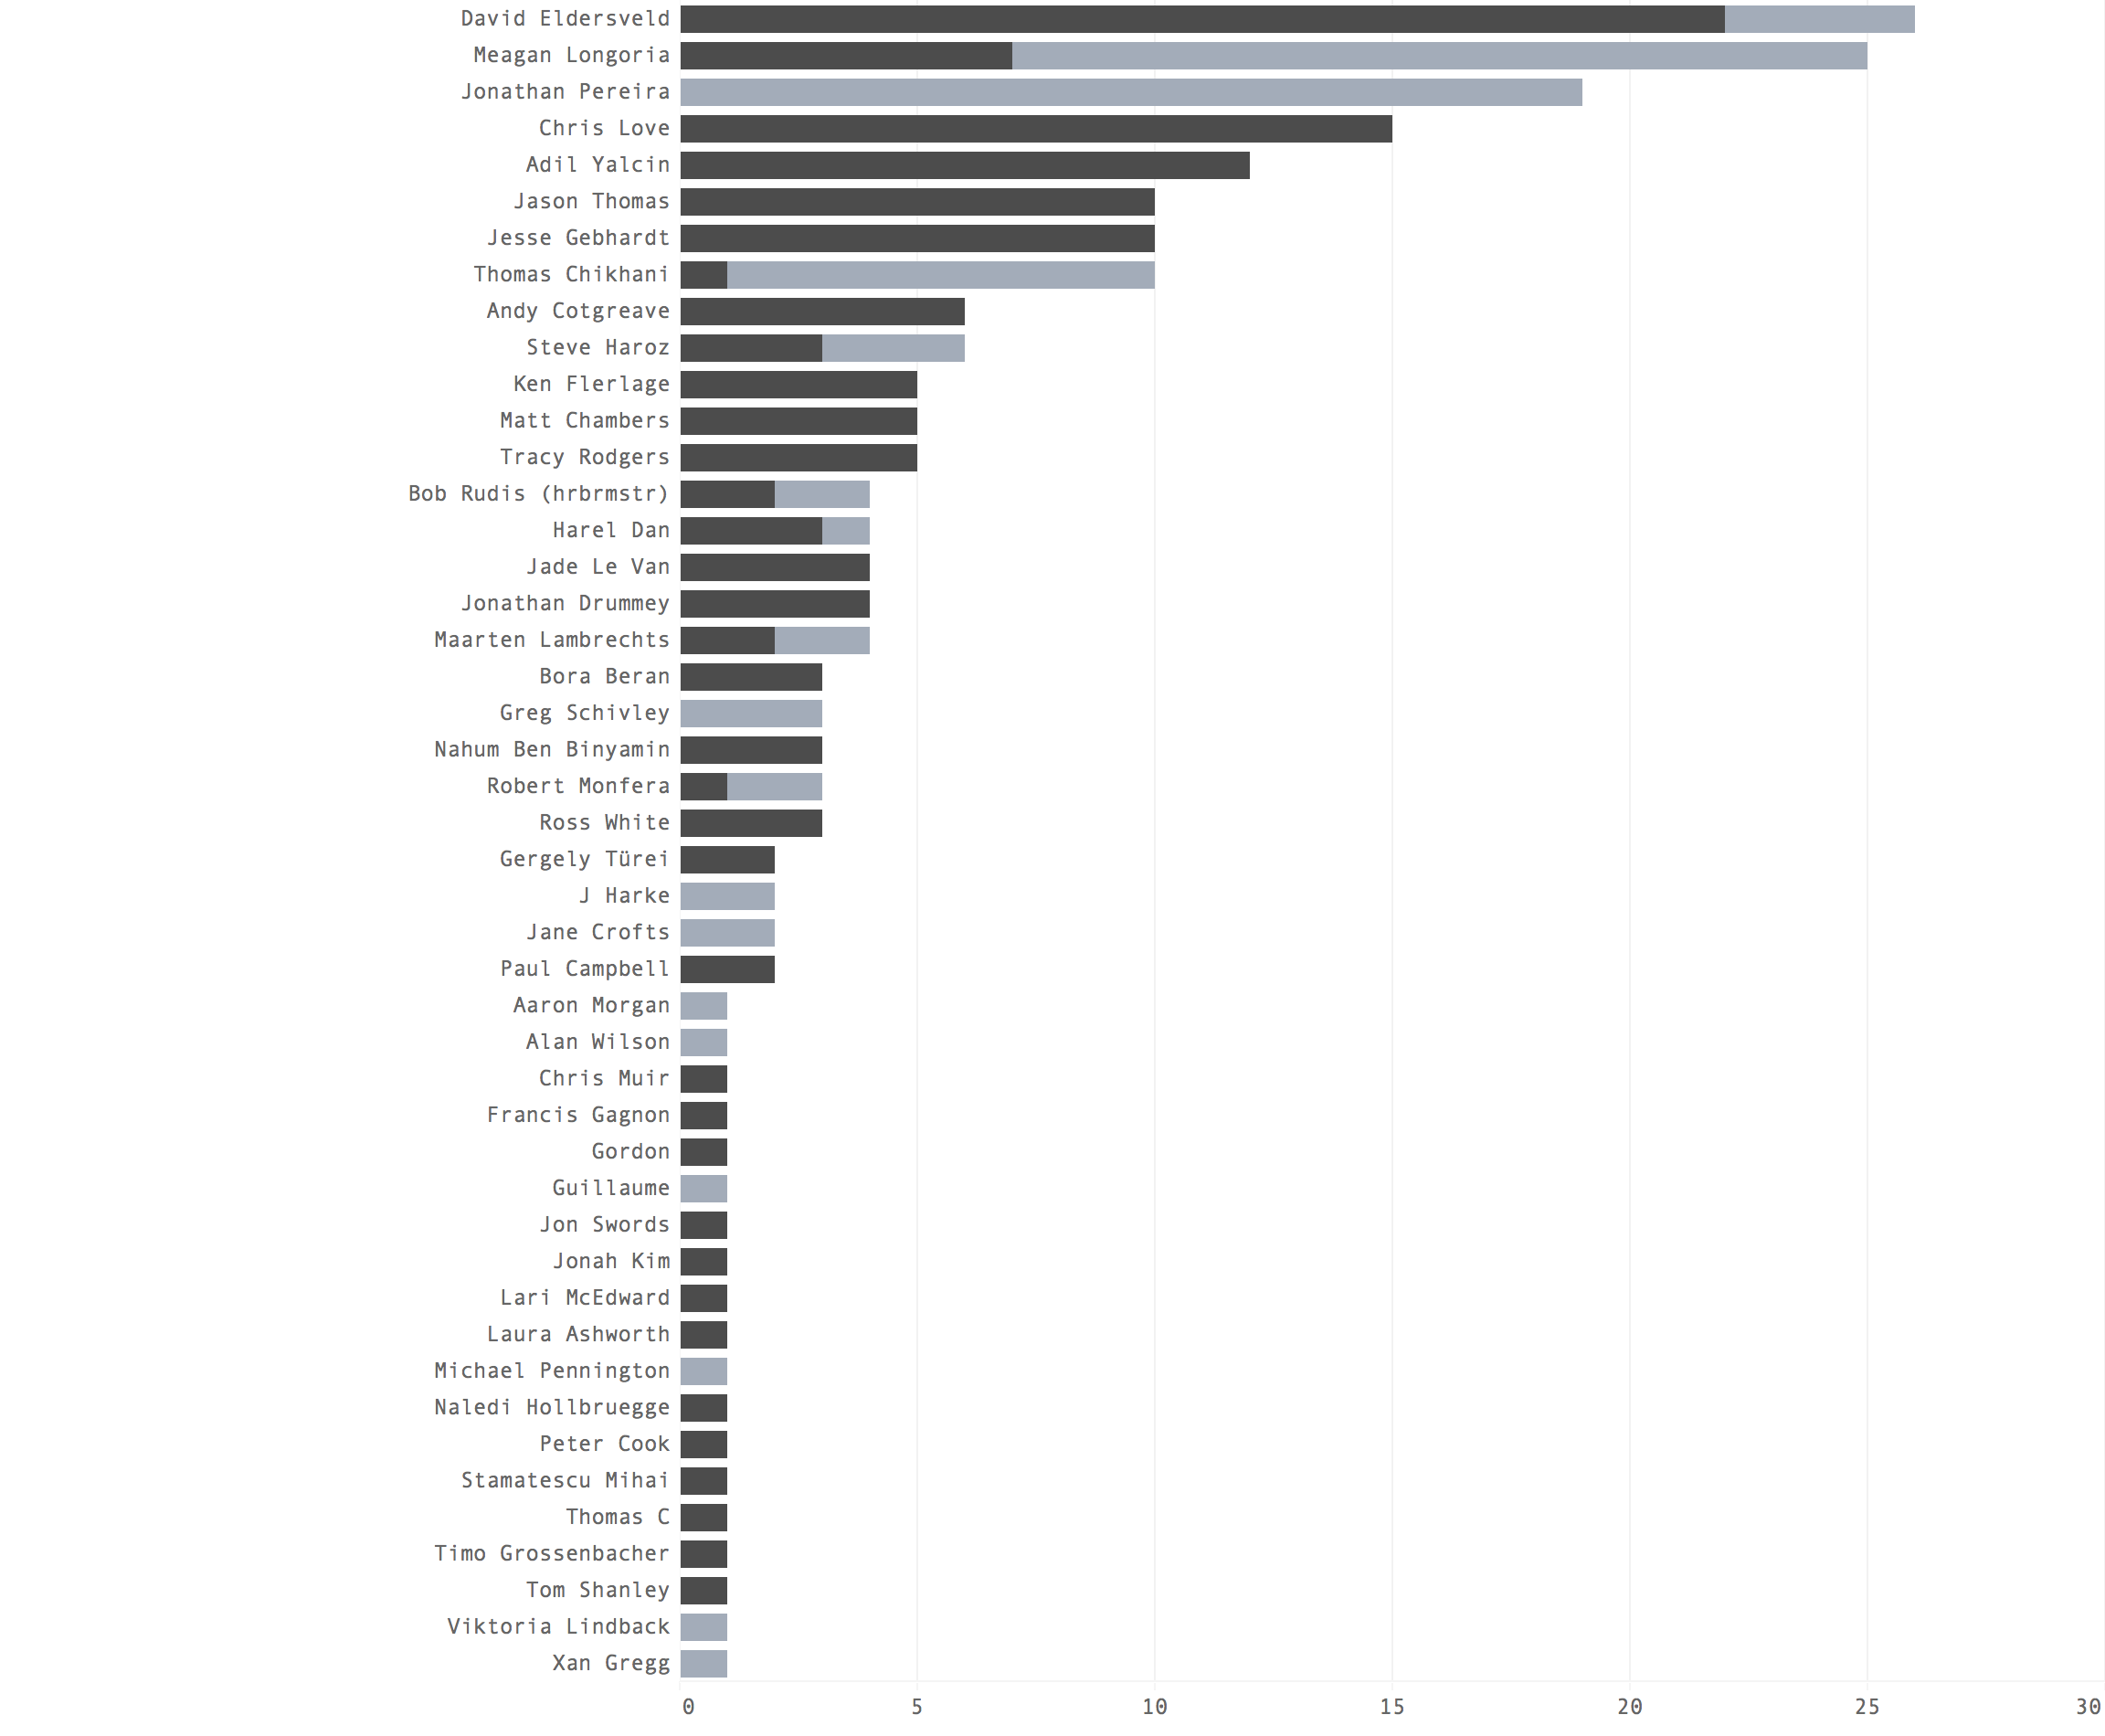
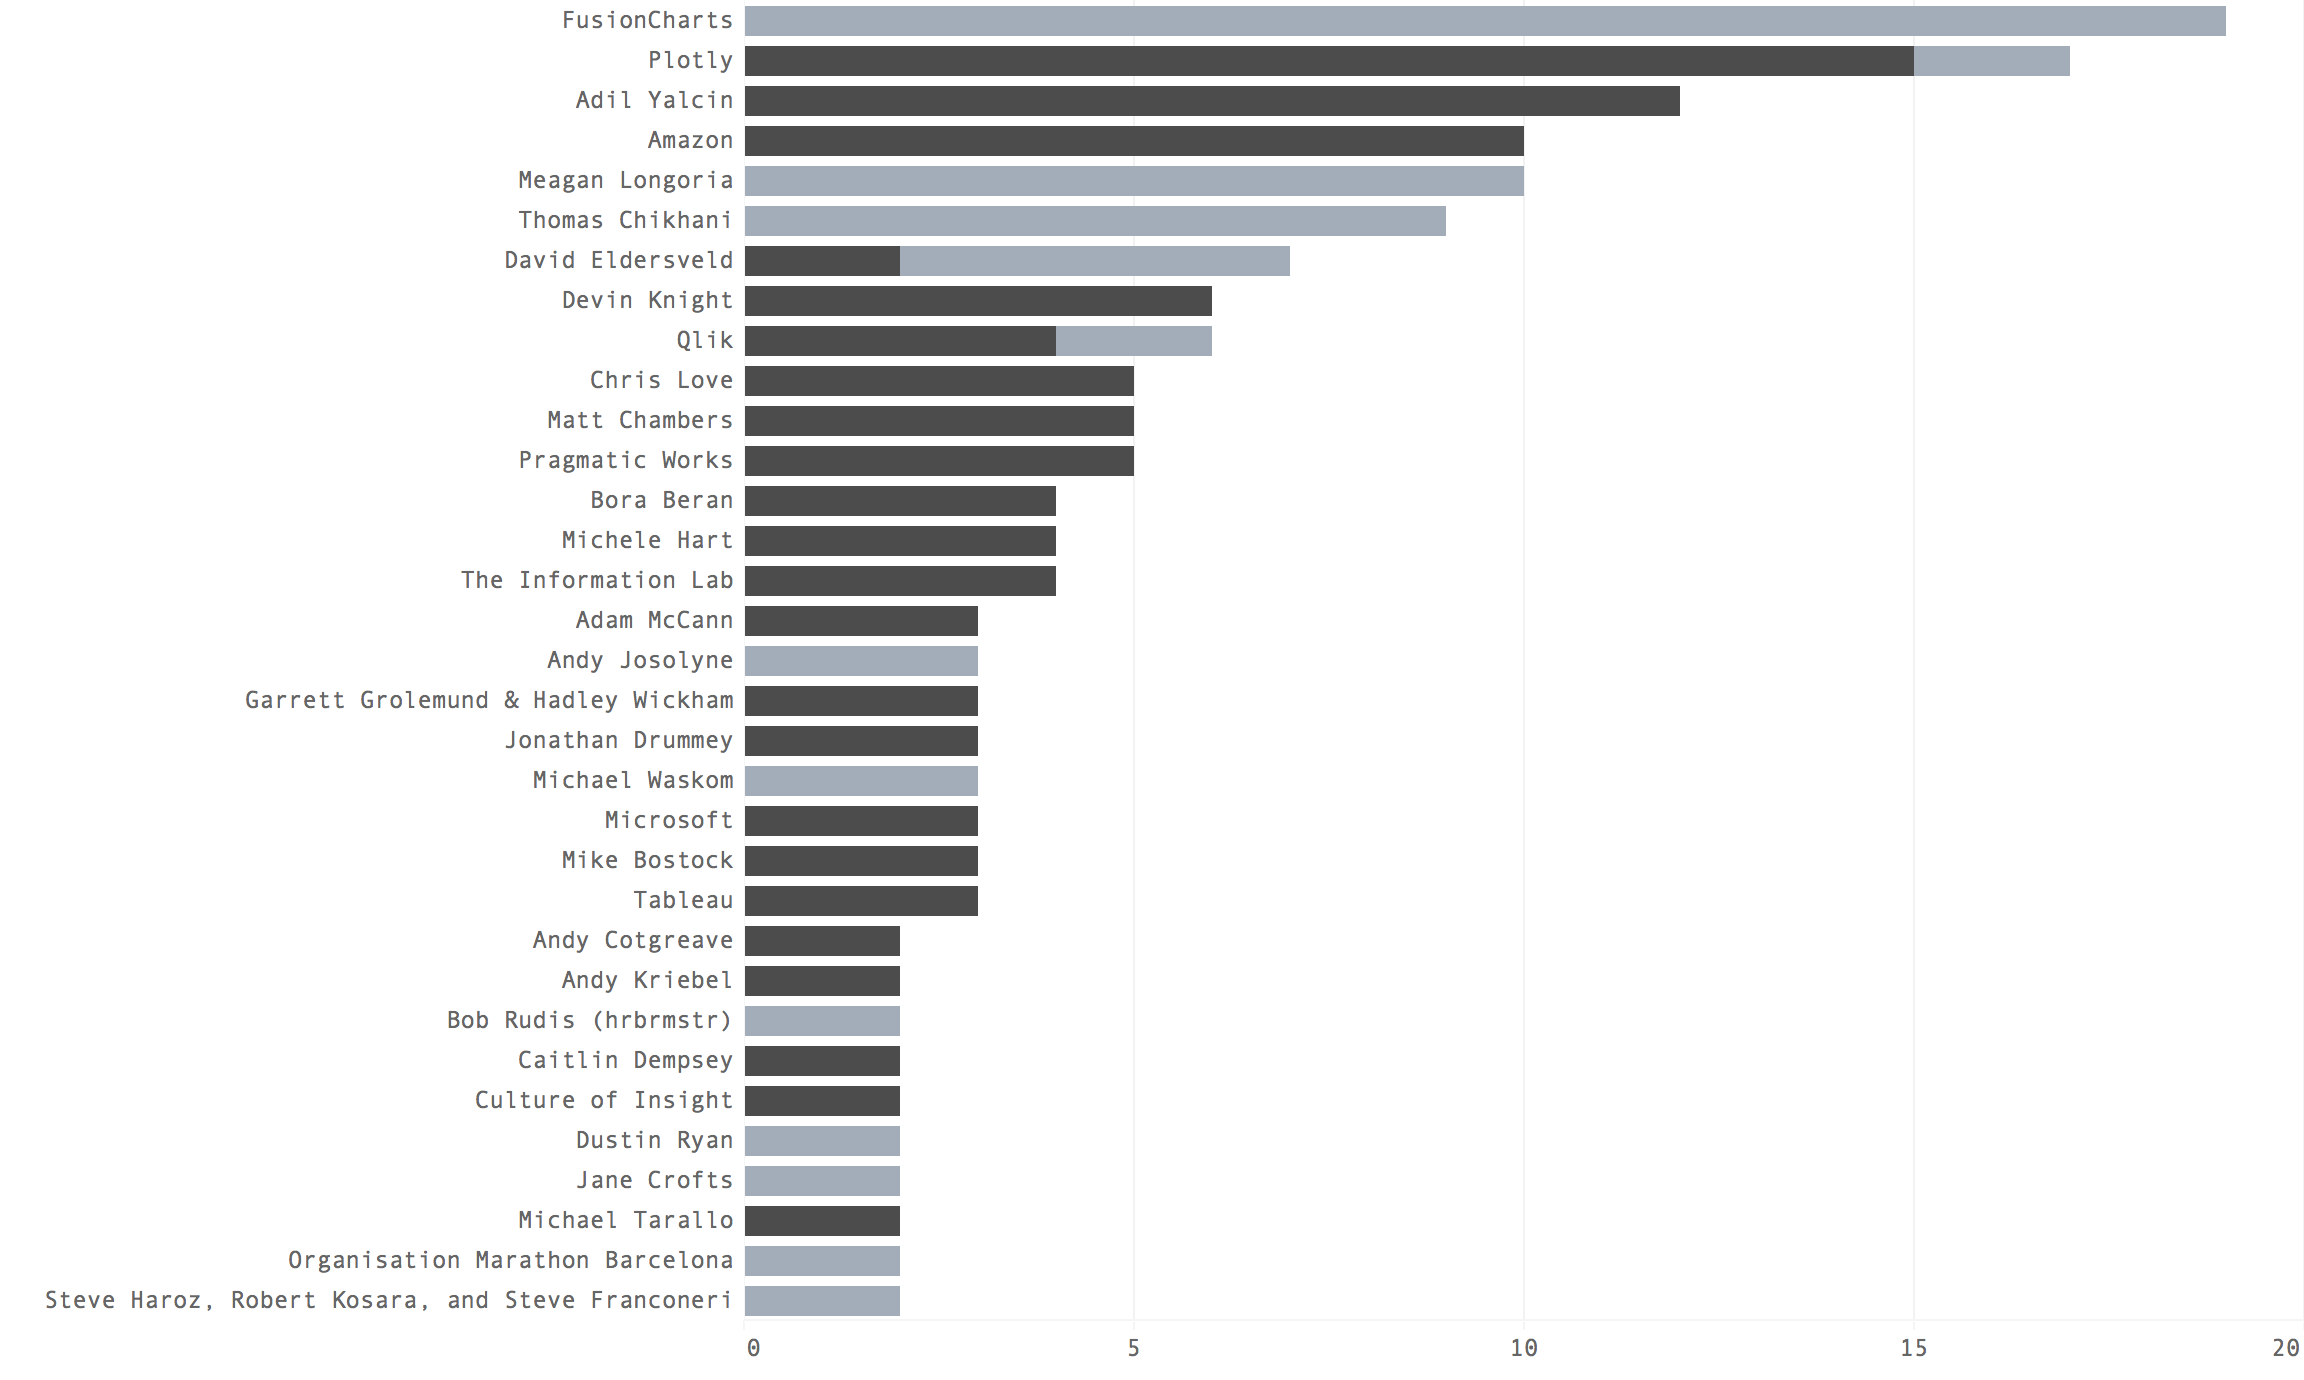
(Dark = ‘Solution’, Light = ‘Example’)
NUMBER OF REFERENCES BY CHART TYPE
NUMBER OF REFERENCES BY TOOL
NUMBER OF DISTINCT CHARTS WITH AT LEAST ONE REFERENCE BY CHART TYPE (OUT OF 51)
NUMBER OF REFERENCES SUBMITTED BY CONTRIBUTOR (Not including me)
NUMBER OF REFERENCES BY AUTHOR (More than 1)
NUMBER OF REFERENCES BY CHART TYPE AND TOOL