
It has been a long time since I had the chance to undertake a self-initiated visualisation project but it was nice to block out a couple of days this week to work on a new graphic to mark the end of the 2015/16 football season.
The project is titled ‘Boom and Bust: The shape of a roller-coaster season’. As a Liverpool fan, the past two seasons have felt relentlessly stressful, with emotional highs frequently offset by crushing lows both across and within matches. Back in January, whilst listening to my podcast of choice, The Anfield Wrap, I was struck by a comment about how refreshing it was to feel relaxed during a recent dominant victory. It was indeed a rarity. It felt like so many games were in the balance for so long you were constantly on the edge of your seat. It drains you.
I therefore decided to investigate the ebb and flows of Liverpool’s matches to see if the shape of the emotions I experienced as a fan would be echoed in the match data. I wasn’t intending on undertaking a delicate qualitative investigation, tracking my feelings across a season of matches, I would just use the instance of a goal being scored as a measure of sensations like delight, despair, happiness, anxiety, frustration and relief.
Whilst there are, of course, many significant contextual emotional nuances attached to any match (expectations, recent form, opposition, history, rivalry) that you would need to truly tell the story of a season, I wanted to keep things as straightforward as possible and use data that would be a ‘good enough’ proxy of my feelings. I therefore just needed to get hold of some simple match data, including fixture information (opposition, home/away, date), the result and the scoring details (goal time and scorer). This was obtainable in different ways from many different places but I chose to use the BBC Sport website as my source.
I got some initial data back in January to start playing with different representation approaches but it was only when the season was finally over (reached on Wednesday 18th May following more crushing disappointment in the Europa League final) that I would have a fixed dataset to work with. Additionally it made sense to do this work as a piece of reflective analysis when the season was complete and, frankly this was also the only window of time I would be able to carve out for myself.
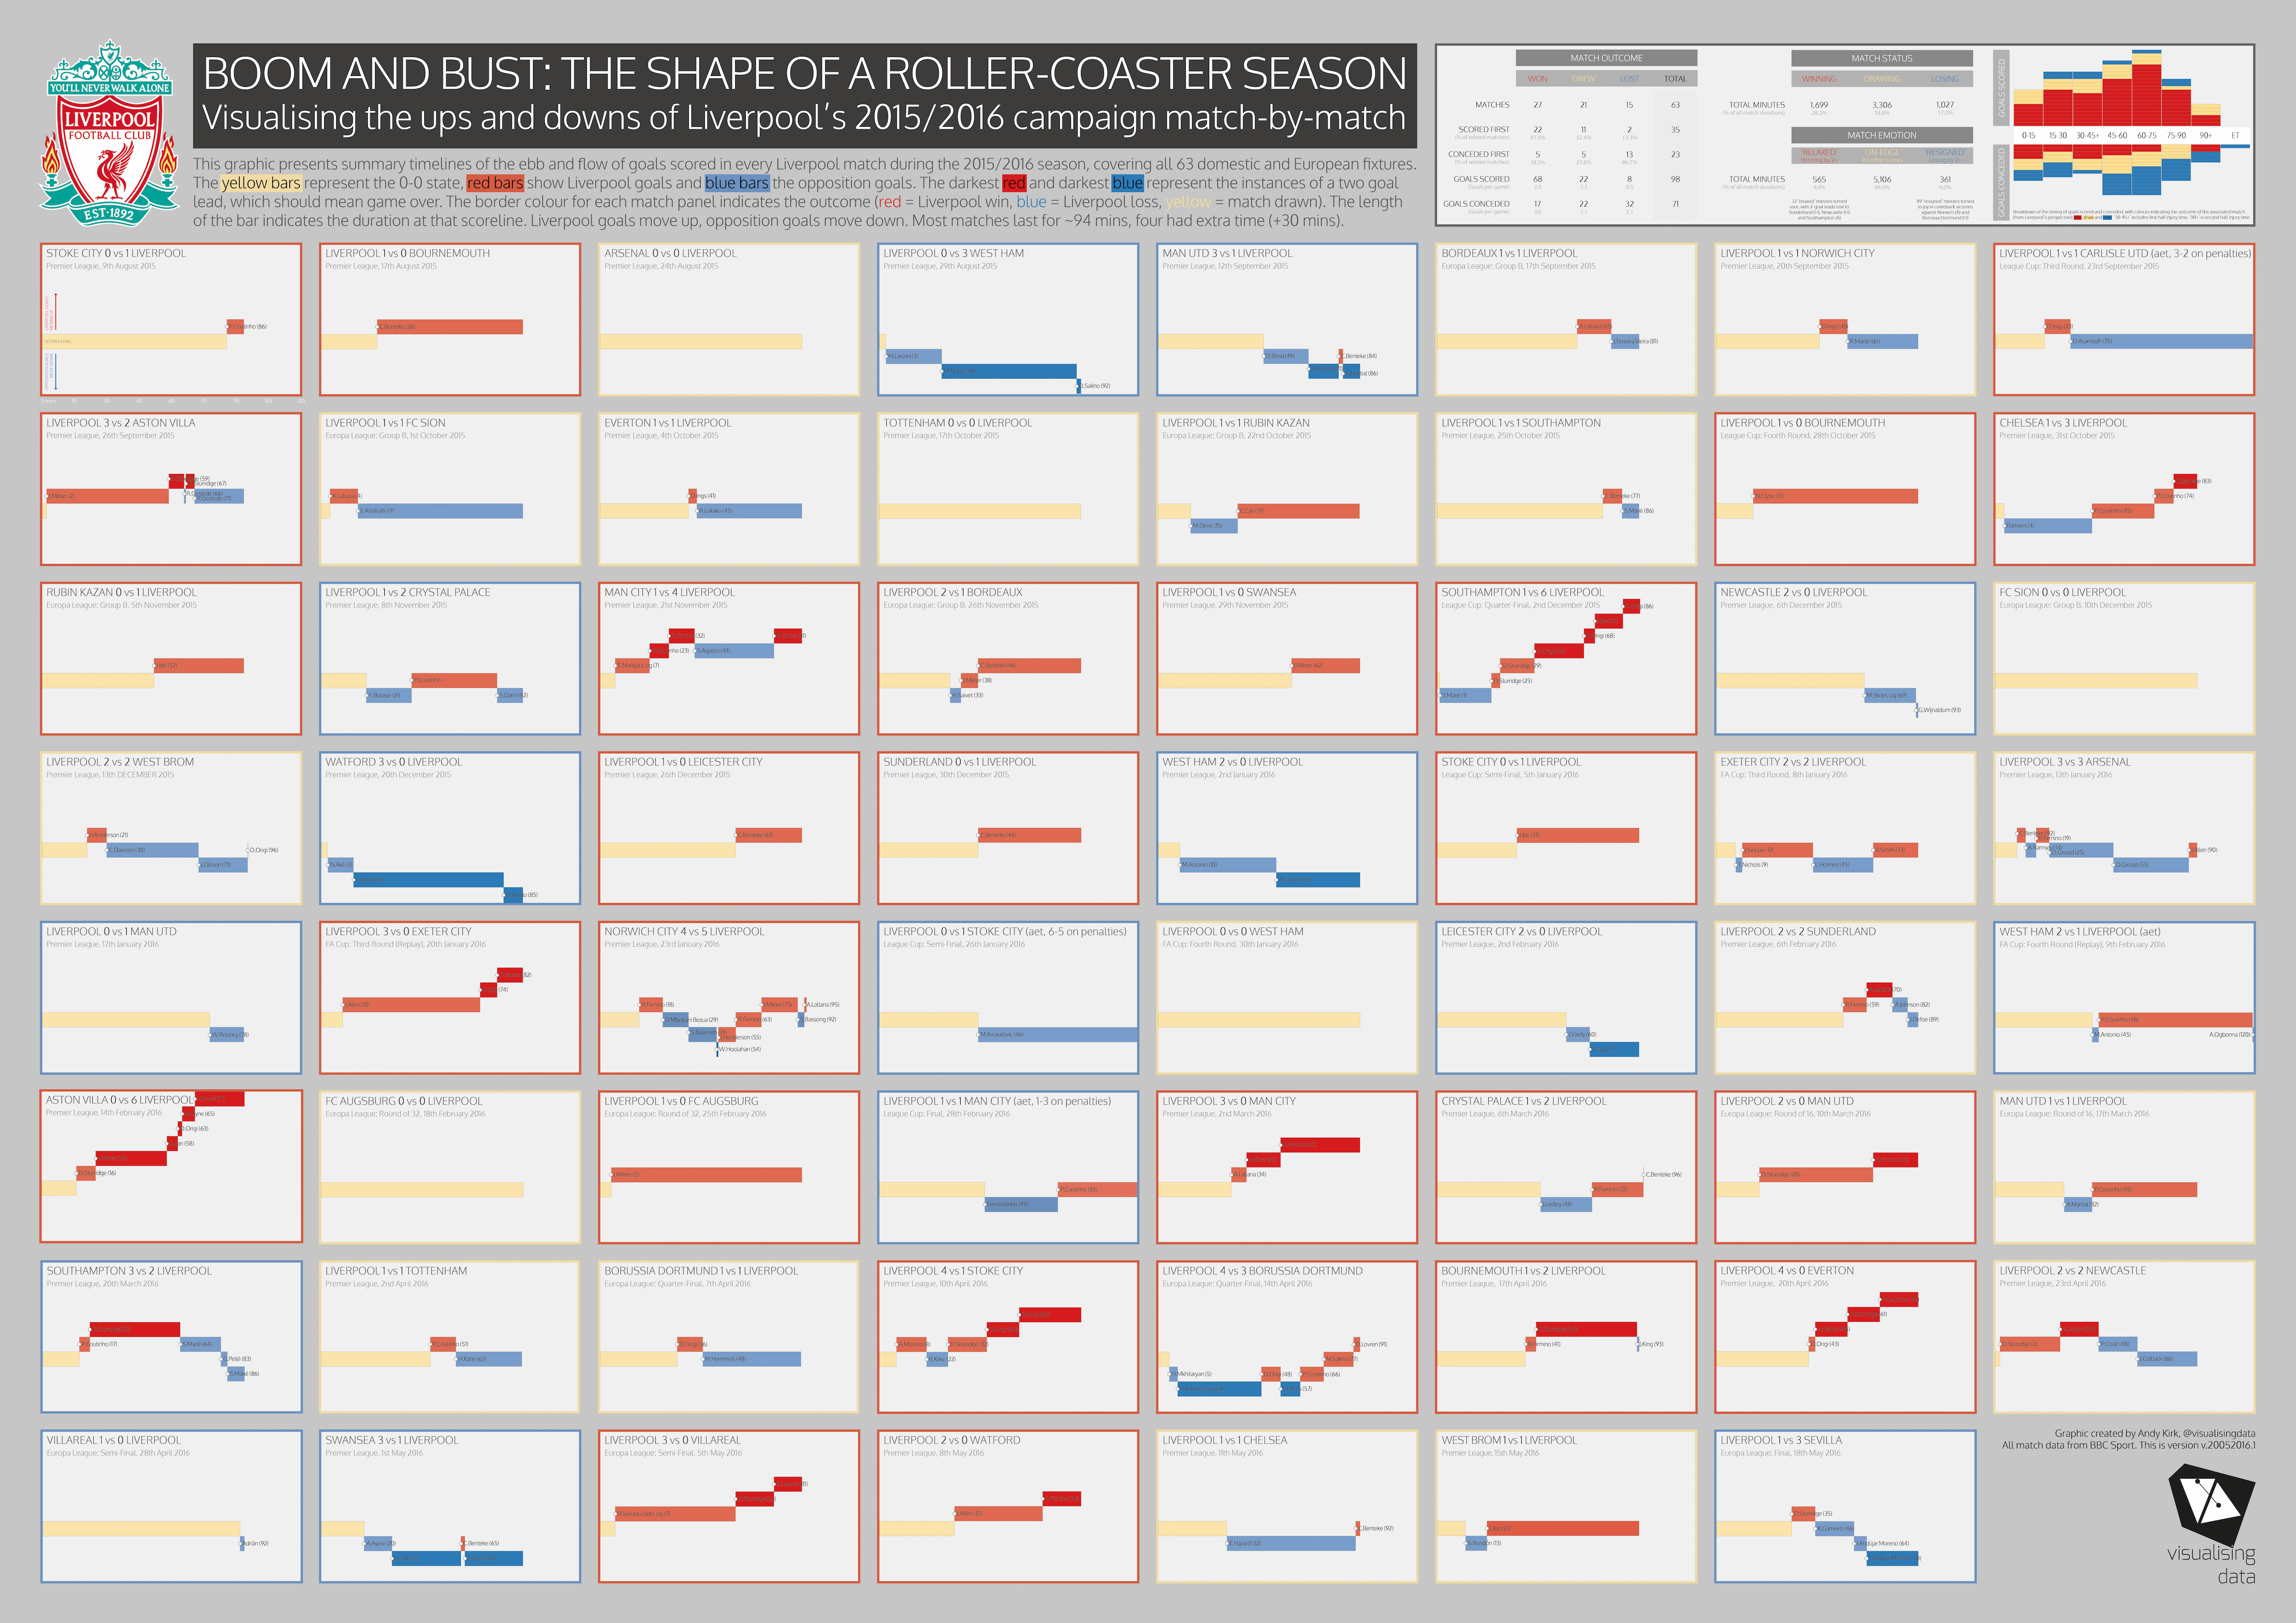
The graphic I have created is ideally intended to be consumed in print form, specifically designed for A2 poster size, which I will be producing for myself to stick up on my office wall. The intended audience is Liverpool fans (primarily) who have experienced this season’s journey and other football/sports fans (secondary) who will be able to understand the nature of the analysis and the subject matter. It is produced to be an exhibitory display of the patterns of data for readers to draw their own interpretation rather than be an example of explanatory work, putting the key insights on a plate for readers. It is also not produced for quick consumption – it takes time to read, requiring effort of the reader to browse around the calendar of match panels.
You can access high resolution versions of the graphic in jpg, png and pdf format via this dropbox link.
The centrepiece of the graphic is a set of 63 small-multiple timelines, showing the ups and downs of the timing of the goals scored or conceded and the duration within each match of the scorelines being.
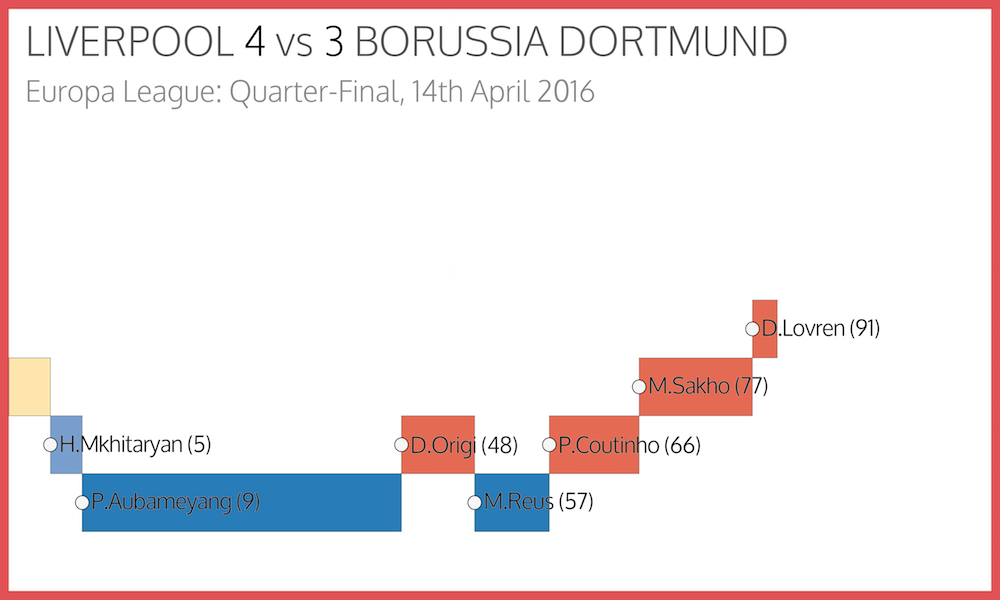
Here is a close-up view of a sample match story, showing the chaotic scoring patterns during one of the season’s most intense highs, the thrilling comeback victory over Borussia Dortmund.

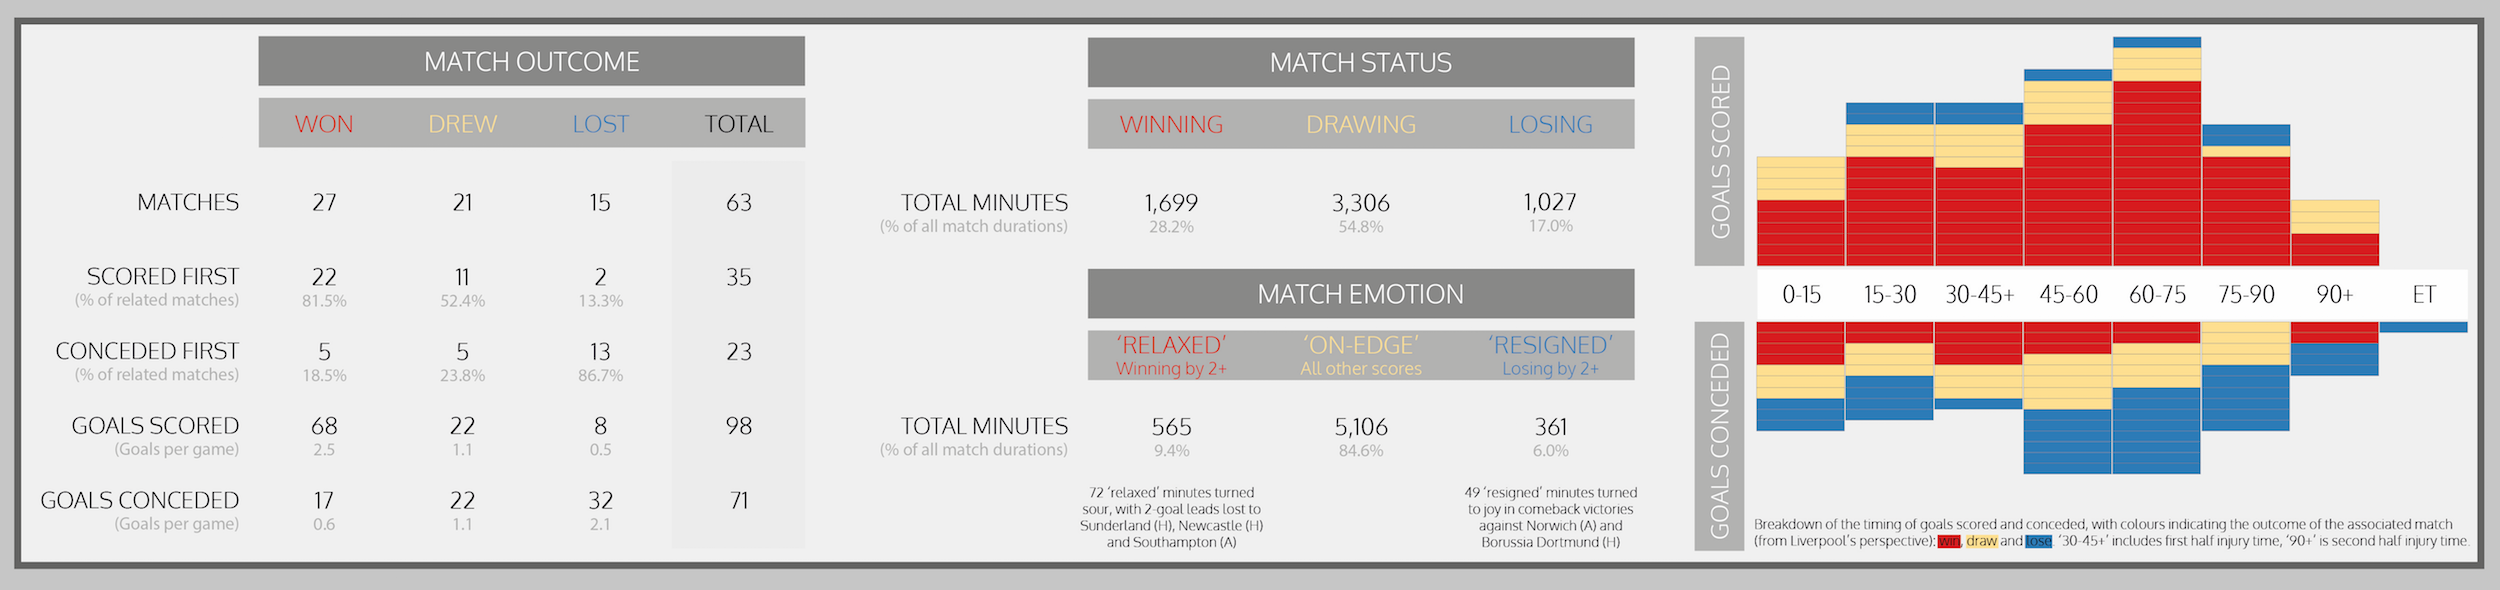
The parade of small multiples is supplemented by a summary panel of headline statistics, breaking down some of the components of success, failure, happiness and disappointment.
The project title, ‘Boom and Bust’ captures the essence of the roller-coaster of fortunes during the season and also deliberately shoehorns the word ‘Boom‘ as famously voiced during an interview by manager Jürgen Klopp.
(I will be providing a detailed design process narrative about this project in some upcoming talks, so rather than go in to detail here I will likely share the slides in due course.)