
To mark each mid-year and end-of-year milestone I take a reflective glance over the previous 6-month period in the data visualisation field and compile a collection of some of the most significant developments. These are the main projects, events, new sites, trends, personalities and general observations that have struck me as being important to help further the development of this field or are things I simply liked a great deal. Here’s the full compilation of all my collections.
Earlier in the year I published a collection for the first 6 months of 2015 and now I’d like to reflect on the latter 6 months of 2015. I look forward to hearing from you with suggestions for the developments you believe have been most significant.
And so, as ever, in no particular order…
1. Decline of the blog?
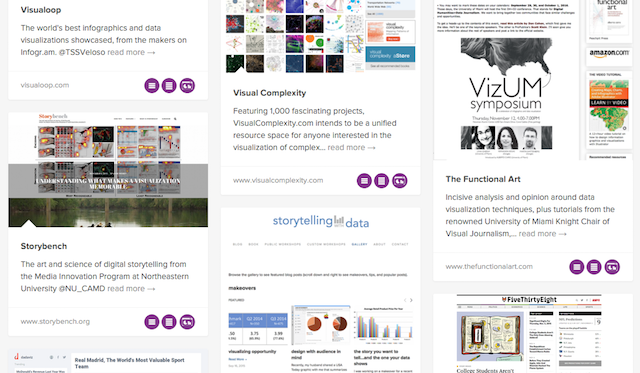
This isn’t meant to be one of those provocative claims about ‘the death of the blog’, more a general sense that, given the growth of the field in recent years, the amount of people blogging about the subject has seemingly flatlined and possibly even declined. It was something the guys also noted in our Data Stories review episode. Whilst Nathan and Tiago are as prolific as ever, Robert keeps the great discourse flowing, and there are reliably frequent and valuable contributions from the likes of Ben Jones, Stephanie Evergreen, and Cole Nussbaumer Knaflic (to name just a few I know there are many more), one of the only new significant entrants (or new to my radar, at least) would be Storybench. Elsewhere there is a noticeable drying up of new posts from Enrico, Andrew, Bryan and Benjamin (amongst others). On the flip-side there has been the emergence of the Data is Beautiful subreddit and the popularity of Medium as a platform for publishing content that might normally exist on one’s own site certainly reflects a changing dynamic. Perhaps the conversation has moved? Certainly Twitter (especially) continues to be the social-media platform of choice and dominates as a location for where much of the discussion and sharing of content takes place.
2. Visual Complexity
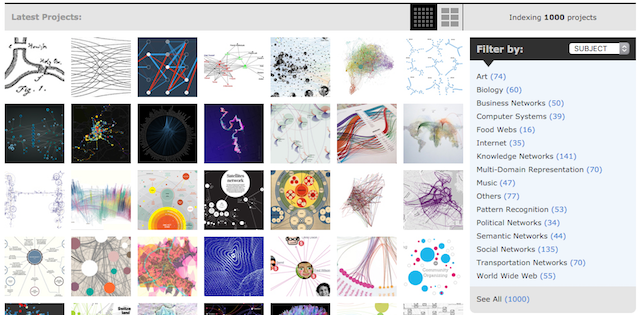
Whilst never really a blog in the conventional sense, it is sad to see the end of future updates to Manuel Lima’s Visual Complexity site. However, it is also a remarkable achievement to have arrived at 1000 posts in the collection in line with the 10th anniversary of the site’s launch. Congratulations and thank you, Manuel, for your contributions and inspirations so far, here’s to your next chapter!
3. FiveThirtyEight
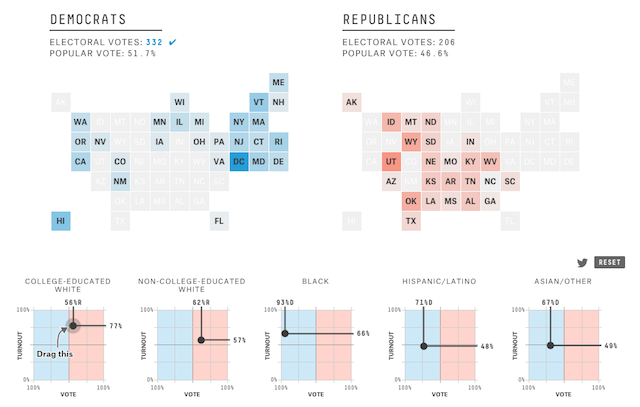
I noted the arrival on the scene of three major new data-driven journalism sites at the start of 2014, namely FiveThirtyEight, Vox and TheUpshot. They each bring a different flavour to the scene and I’ll talk about the latter two over the next few items but I feel this year has been especially strong for the team at FiveThirtyEight. In particular I feel they are leading the way with their presentation of (typically static) visual analysis in response to interesting curiosities or investigations about a varied range of contemporary topics, such as this piece looking at the under-representation of black students at universities, the value of NFL kickers and the ‘Death Spiral Of M. Night Shyamalan’s Career‘. 2016 will surely be a hugely significant year with the US Election so I look forward to another deluge of fascinating and carefully curated scatterplots!
4. 100 years of tax
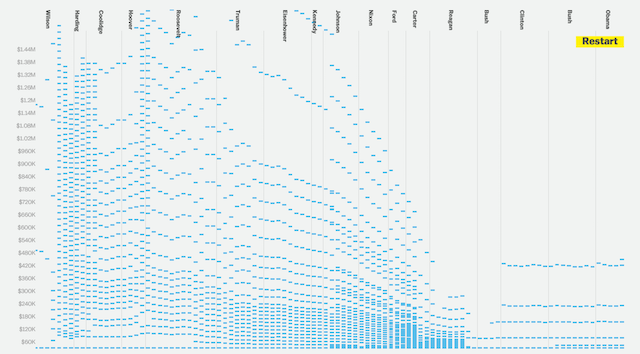
A contemporary of FiveThirtyEight, it would be fair to say Vox has had an inconsistent beginning to its life as a separate data journalism entity from the perspective of its data visualisation output but the arrival of Javier Zarracina and the presence of talent like Alvin Chang seems to be gradually bearing fruit. Certainly, this piece looking at the 100 years of US tax brackets, as I posted recently, is amongst the best examples of the value of data visualisation that I’ve seen all year.
5. Calling out the deceivers
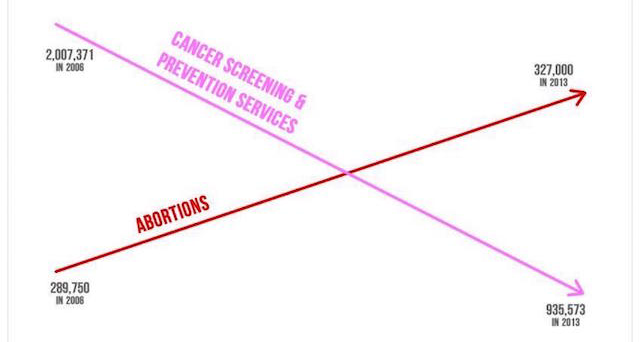
This is not necessarily a trend that is easy to evidence or quantify but I feel there is a broader awareness of the dark arts in visualisation, not just from makers but predominantly from readers. This gives me a warm feeling inside that there is a general improvement in the visualisation literacy of the general public at large. The stand out moment of the year came with this dreadfully dishonest chart created by American’s United for Life (AUL) and presented to a Congress hearing by Rep. Jason Chaffetz to question Planned Parenthood’s activities. Vox led the way with publicly highlighting this shambolic mis-representation and shaming its makers, as did Politifact (who gave it a deserved ‘Pants on Fire’ rating). It even appeared in a section on John Oliver’s ‘Last Week Tonight‘ show. Rather than accepting the charting mistakes, AUL responded with surely the most squirmingly embarrassing of attempts to excuse its shortcomings.
6. Gregor Aisch
Just to wrap up this sub-theme, I feel it is worth acknowledging the standing Gregor Aisch has now achieved in the field. Whilst the New York Times team, as we all know, has some incredible people (and recently lost some as well) it has been increasingly visible just how talented this guy is. Whilst rarely working alone, Gregor’s name has repeatedly appeared against some of the most astute and brilliantly-executed pieces coming from TheUpshot, in particular, across the entire year. Just over two years since he moved to the US and joined the Times, it is a pleasure to witness somebody at the absolute top of their art.
7. Just when we thought everyone was getting on…

‘What Is the Best Response to Bad Practices?’ saw Stephen Few, in classic fashion, stir up the age old debates again with his seemingly annual attack on David McCandless. Take the phone off the hook, put the kettle on and get comfortable. They say never to read the comments – at the time of publishing this there were over 75 – but maybe in this case you should if for no other reason than to get a sense of the spectrum of entrenched dogmatic views that still exist and to find those voices who sensibly offer more pragmatic and nuanced perspectives. If you thought the field had grown up – with a greater mutual respect for legitimate differences and distinctions – maybe this reveals that we have some way to go. It certainly woke me up from my own complacency/hope that the traditional arguments had been answered and resolved several years ago…
8. Visualising death(s)
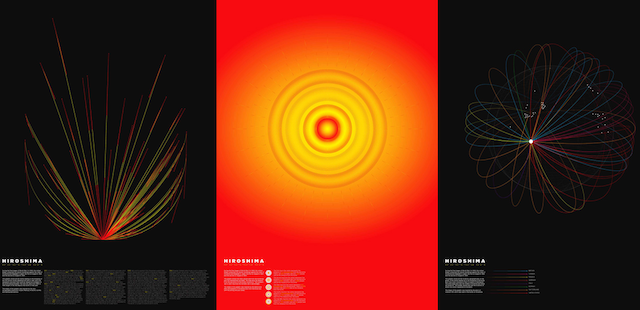
Another debate, albeit on a much smaller scale, that I was interested over the last period concerns the issue of the representation of death or deaths. What is the best and, more importantly, the right way to show statistics concerned with the loss of life? This issue came to the surface is FastCo Design’s one-sided and rather shallow piece ‘Why You Don’t Make A Mindlessly Beautiful Visualization Of A Horrific Event’ which rather hid behind prominent names objecting to a work visualising Hiroshima (shown above) but without giving a voice to the maker of the these works to offer perspective on the motives, context etc. Whilst I understand the sentiments expressed by those quoted the article failed to further the discussion in any valuable way. Published last year, I feel this article by the consistently brilliant Sarah Slobin, continues to offer great insight on the challenges all designers are likely to face at some point – visualising statistics about death. As somebody who has discovered this year that (accidentally) I include many examples in my training workshops related to project about death, I feel it is a really important and sensitive issue to have a more constructive discussion about. If I get the opportunity in 2016 I may even seek to construct a presentation talk about this topic.
9. Virtual Reality
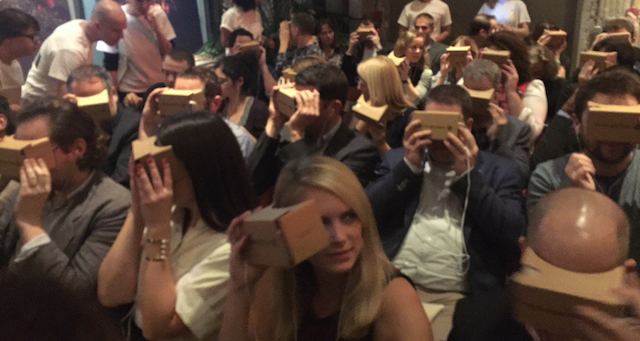
This is a term that seems to be gaining more momentum and airtime over these past few months. Led, in publicity terms at least, by the New York Times through their issuing of over a million Google Cardboard smartphone viewers, there does seem to be a new wave of experimentation around creating virtual reality experiences to present stories and, potentially, to explore data. They are not alone, with other organisations (LA Times, WSJ) also exploring its creative potential – although some don’t believe this to be genuine VR. Though I respect and value any attempts at innovation, I feel this will be a passing trend. At most it will have a fringe role in visualisation simply because of what you see in the photo above – the awkwardness and cumbersome nature of having to use a viewer, just like the stunted progress of 3D movies. However, I remain open to being persuaded that there is a prominent role for this technology in visualisation.
10. Increasing integration of multimedia
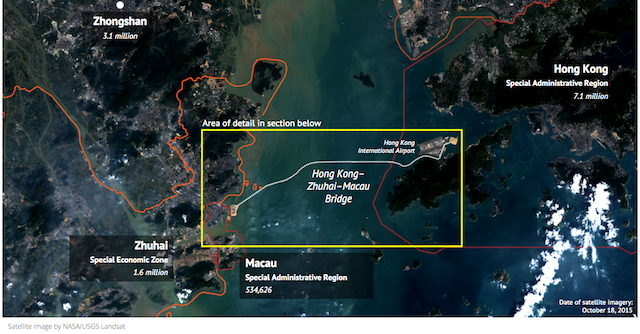
This is certainly not a new trend but it does feel like we are reaching an era of where the creative possibility of incorporating imagery, illustration and video in to data visualisation is becoming even more commonplace. Monica Ullmanu’s work on ‘A tortured heap of towers: the London skyline of tomorrow‘, Allen Au-Yeung and Cédric Sam’s ‘Three Cities, One Bridge‘ for The South China Morning Post and Derek Watkins’ ‘Japan’s New Satellite Captures an Image of Earth Every 10 Minutes‘ for the NYT are just some of the contemporary examples that bring integrate data driven content alongside inventive sources of rich imagery (increasingly from satellite and drone origins) and seamless video.
Special mentions…
Here are the other highlights from the second half of 2015 that deserve a special mention:
Guardian Ashes charts | I just loved these small thumbnail charts from Carlo Zapponi to offer, in a single view, a sense of the ebb and flow of the England vs. Australia cricket matches down the years
Mapbox Studio | Alongside CartoDB, Mapbox have unquestionably been significantly changing the landscape of thematic mapping for everyday and advanced users alike and the announcement of the availability of Mapbox Studio to all Mapbox account holders seems like another great leap forward towards beautiful, effective spatial visualisation
Strip Plots | I’ve always loved these kind of plots (though I’d never previously considered or been aware of this name for them) and here Maarten Lambrechts offers a really nice explanation of why and how to use this technique
What’s warming the world? | Super piece by Bloomberg, exploring different factors that might explain (or not) why the world is warming
