
With the dust settling after the UK elections, a brief reflection on the winners and losers from a data and visualisation perspective:
Two Winners
Cartograms
As I stated a couple of weeks ago, these things are everywhere right now…
Cartograms. So hot right now pic.twitter.com/By1GHCjlbl
— Andy Kirk (@visualisingdata) April 28, 2015
…and they have never been deployed to such good effect and in such an across-the-board sense. During the build up to and night of the election, cartograms emerged as the real star.
The bright point of a largely negative election was the extensive use of cartograms. Congs to carto-pioneers @dannydorling @geoviews et.al.
— Phil Knight (@PhilipWhere) May 8, 2015
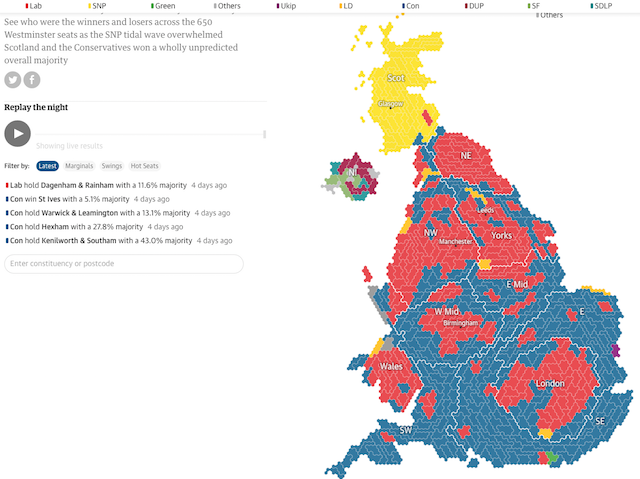
The tracking of the predicted and actual outcome of the election is so well suited to the cartogram approach, sacrificing geographical precision for a more equitable visual weighting for each individual constituency, the voting outcomes of which are so critical to the ebb and flow of the overall election results. This first example comes from the Guardian:
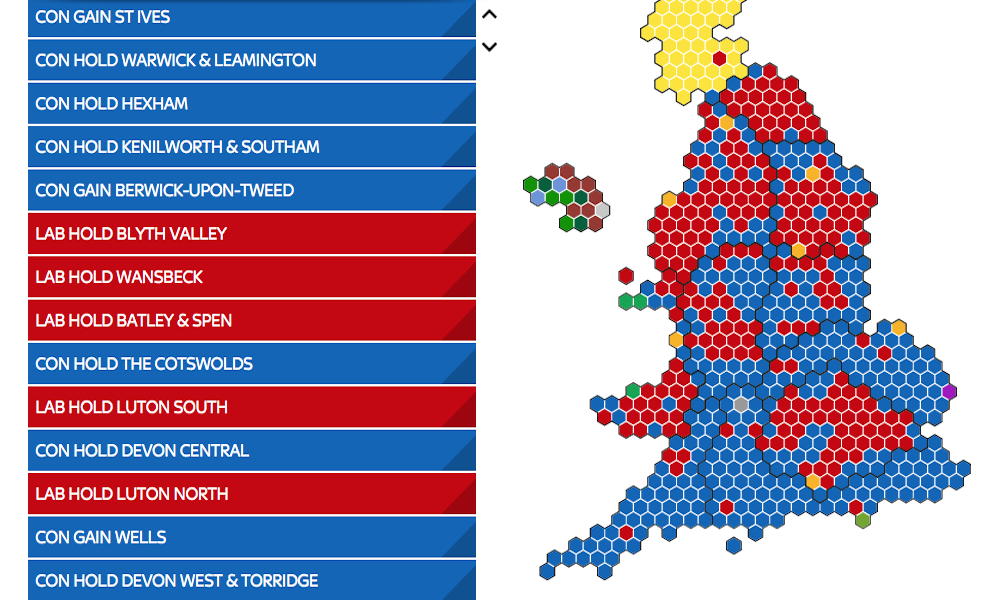
The hexagon, with its reasonably flexible tessellating qualities, provides a great geometric option to build up the election picture, as shown by this in the Telegraph:
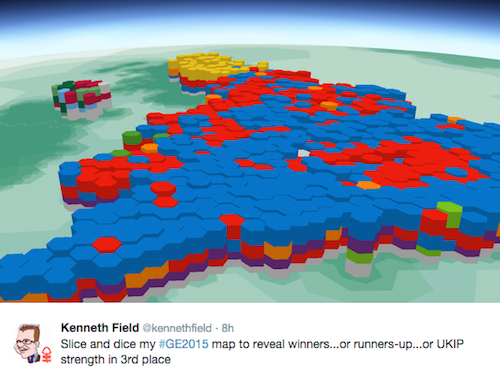
Kenneth Field, of CartoNerd acclaim, is working on an interesting looking experiment to take the election hexagon bin map results into a 3D landscape, breaking down the votes of each constituency in stacked hexagon bars, creating the look of the Giant’s Causeway.
Not everything was digital. We had the BBC’s excellent and huge outdoor cartogram (that I cleverly, I’m sure you’ll agree, coined the ‘elecxagon’ map)… It’s excellence was enhanced further by confusing those cretins at the Daily Mail.
Giant election hexagon (elecxagon?) bin map outside the Beeb RT @simonmayo: I reckon I'm in St Agnes pic.twitter.com/8MSL6Ezypz
— Andy Kirk (@visualisingdata) May 6, 2015
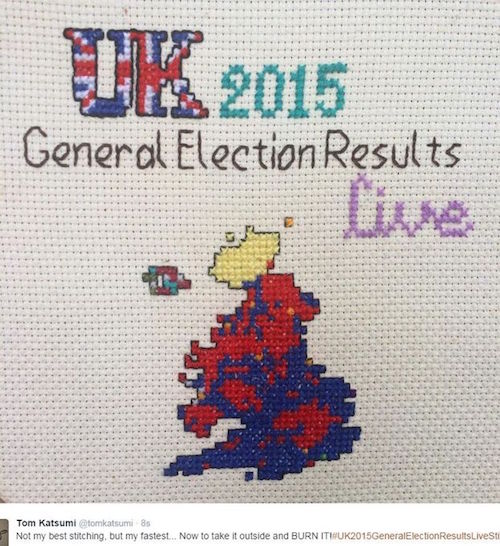
…and then there was Tom Katsumi’s almost-live cross-stitched cartograms
High quality UK visualisation work
There was some very high calibre visualisation coverage across many different news and media outlets but the standout work (in the UK at least) emerged, perhaps unsurprisingly. from the Guardian, the BBC and the Financial Times. These three organisations are at the top of their game right now and leading the UK data journalism and visualisation landscape.
(1) eg. RT @fcage: The four pages of election graphics in today's @guardian are beautiful. Congrats @CathLevett pic.twitter.com/ZHpXPeUC7i
— Andy Kirk (@visualisingdata) May 9, 2015
(2) eg. MT @BBCNewsGraphics: Mapping the 2015 election results http://t.co/LpcfaIOTeq #GE2015 pic.twitter.com/fPgTbrbAJD
— Andy Kirk (@visualisingdata) May 9, 2015
(3) eg. MT @jburnmurdoch: Watch the UK political landscape & other key narratives from #GE2015 http://t.co/uDpH6m27ln pic.twitter.com/yTCDfcPVEs
— Andy Kirk (@visualisingdata) May 9, 2015
*There is a nice round-up of some of the election visualisations on BuzzFeed*
Two losers
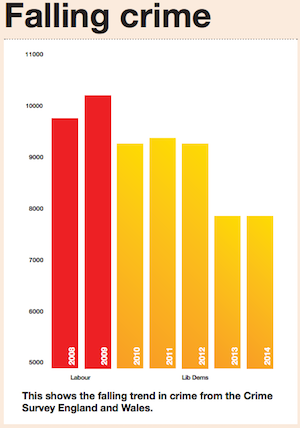
Liberal Democrats’ Visualisation Integrity
Whilst there were surprisingly few examples of corrupt visualisation work, the Liberal Democrats – the big losers in the election itself – offered up the dodgiest data visualisation work, a theme that has continued on from their efforts back in 2010. I’m not saying that their political performance is linked to their visualisation output but…
Attribution
There have been many recent examples of twitter users taking other peoples’ work and ideas and passing it off as their own on tweets that then generate traffic and attention, blatantly failing to attribute the original author.
Many you will have seen the pattern formed by the predicted GB (not UK, as Northern Ireland missed off) political map compared to Maggie Simpson. I first saw this in a tweet dated 29th April.
Maggie from the Simpsons?! pic.twitter.com/yheS65j0PB
— Ben (@0point5twins) April 29, 2015
This might not be the original, but it was certainly shared enough and predates the endless copycat tweets that went viral after the results came in, with @serialsockthief and @suffragentleman just two of many others who failed to acknowledge where they’d seen the original. Maybe they are unfortunate exhibits to pick on and perhaps they independently came up with the very same idea…
Whilst the Maggie Simpson thing is more comedic than visualisation, there was another example that really caught my attention. This astute piece of analysis by Vaughan Roderick, looks at the patterns of voting matching some of the traditional coal mining areas of the country.
Do I get a prize for this? Distribution of Labour seats compared to England and Wales coalfields. pic.twitter.com/9xeQERU9mR
— Vaughan Roderick (@VaughanRoderick) May 9, 2015
Once again, this has been blatantly ripped off by others without the slightest hint of acknowledgement. @Amazingmaps and @Bowgroup should hang their heads in shame. Particularly as both were told who did the analysis and who should be attributed. Amazing Maps even faved the tweet telling them who the author was!
I appreciate there are character restrictions on a tweet but a follow up tweet with details of where the original came from is surely the least that can be done.