

A theme of steadily increasing interest to me and many others in the field right now is the ideal of physical data visualisation. Not just visual sculptures as data art but actual tactile representations of data that maintain and offer function.
In one of the recent data stories episodes (#17, the vodpodcast), Moritz and Enrico interviewed Pierre Dragicevic and Yvonne Jansen from the Aviz Lab at INRIA in Paris. They were talking about their research into the techniques around physical visualisation and their website has a great collection of examples (new and old). One of the pieces I spotted on here was an example I was alerted to at the NYC data viz meetup back in November and it motivated me to write about it here.
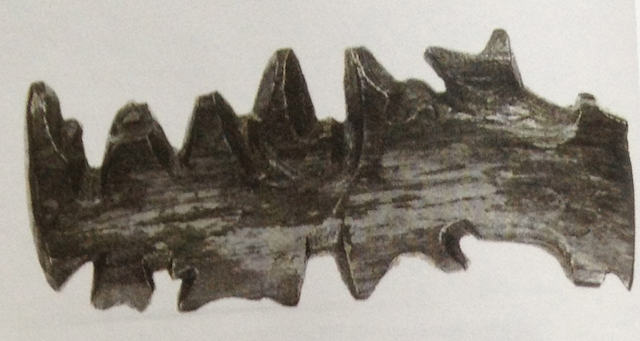
At this event Mark Daggett gave a great presentation about Inuit wood maps. These are very different in their purpose compared to great work like the lazer-cut wood maps we have seen recently. Their purpose is to (or was to) provide a tactile mapped representation of the relief of the coastline of Greenland, allowing the Inuit to appreciate and identify the contours, islands and glaciers (etc.) of the coastline. It is not a direct/figurative map in the sense that the coastline goes up one side and down the other.
In Mark’s presentation he recreated the clever way Bill Buxton introduces this design solution in his great book ‘Sketching User Experiences‘ (pages 33-37).
I can’t remember word for word how Mark did it but it was along the lines of Bill’s approach so I’ll paraphrase that:
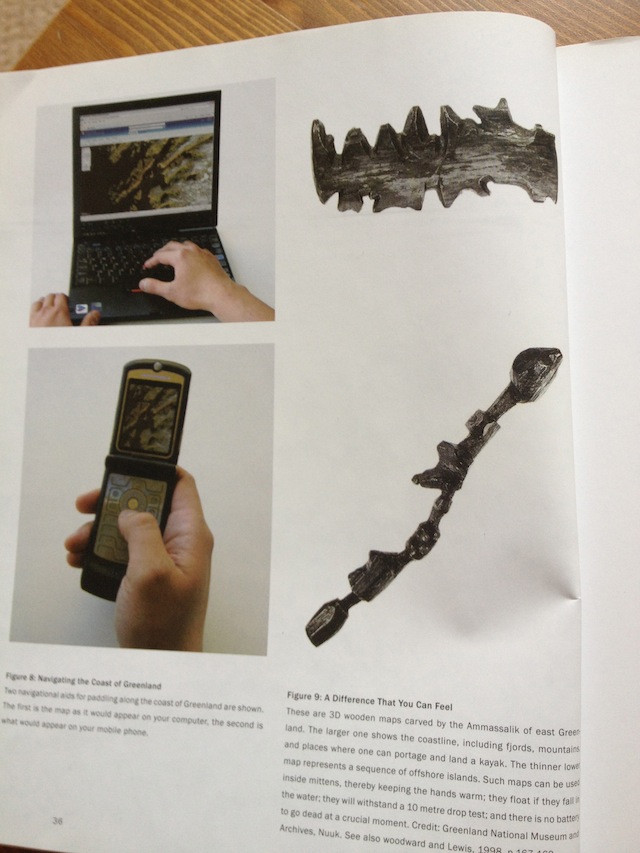
- You are kayaking along the coast of Greenland and you need a chart to navigate
- You can’t use paper because it will get wet and will be hard to fold/unfold
- There is every chance you could drop it in the water
- For six months of the year it is dark
- You don’t have your PC with you in the kayak
- There is no cellular service to use a mobile
- It is too cold to risk using anything that involves taking your gloves off
With the wooden map it doesn’t matter if it gets wet and will float if dropped in water. It is sized in order to fit inside the glove/mitten and small enough to just navigate around with your fingers. There is no battery life issue and it doesn’t matter if it is light, dark, hot or (more likely) cold. Perfect solution!
As Bill Buxton remarks:
“…this examples reinforces my thesis that in order to design a tool, we must make our best efforts to understand the larger social and physical context within which it is intended to function.”
In my forthcoming training course 2.0 upgrade I am going to incorporate artificial external factors like these to put more focus and pressure on delegates in their concepting exercise.
You can also read about the maps here and check out the link at the bottom for Polynesian stick charts.