Datawrapper is a brand new tool unveiled by ABZV, a German training institution for newspaper journalists, but primarily the result of the vision, talent and commitment of Mirko Lorenz and Nicolas Kayser-Bril.
Datawrapper provides an Open Source platform for users to upload data and create simple, embeddable data visualisations and is particularly targeted at the data journalism field to facilitate the quick utilisation of visualisation to enhance written articles without requiring a platoon of developers and designers. Of course, its simplicity makes it attractive to a far broader demographic but I know this is where much of the motivation for the development came from.
The functionality of Datawrapper is very simple. You just search for a data set (Excel, Google, web table), copy it, paste the contents into Datawrappers first screen and then follow the instructions to construct and customise the visualisation before copying the embed code and pasting it on to your own web page. At the moment there are five visualisation types available: Line, Bar, Pie, Table and, interestingly, Streamgraph, but these options will be extended in due course.
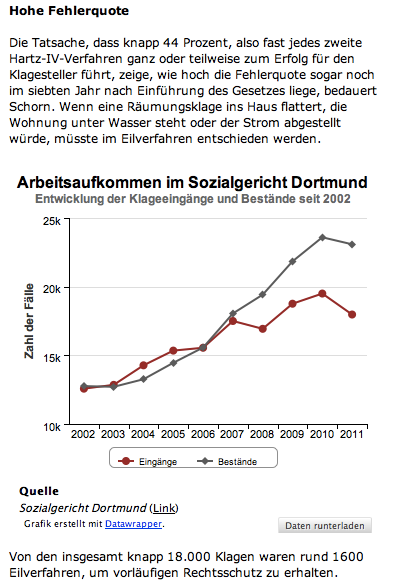
The version launched will simply be a starter, with an ongoing cycle of development, enhancement and refinement. There has already been much interest in this offering and Dortmund Newspaper Ruhr Nachrichten has already demonstrated the use of the embeddable tool in a story published online yesterday.