One of the increasingly frequent questions I get asked, particularly by people from a scientific or financial domain, is how to effectively visualise uncertainty of data and of statistics. My response is usually to make suggestions around annotated markings and/or colour gradients to indicate increasing or declining certainties.
I’ve been gathering bits evidence for these suggestions and any other sample solutions that might work in different contexts. There aren’t that many but I have compiled some references, papers and examples for anyone interested. If any others emerge I will add them to this list, so if you have any suggestions, please let me know:
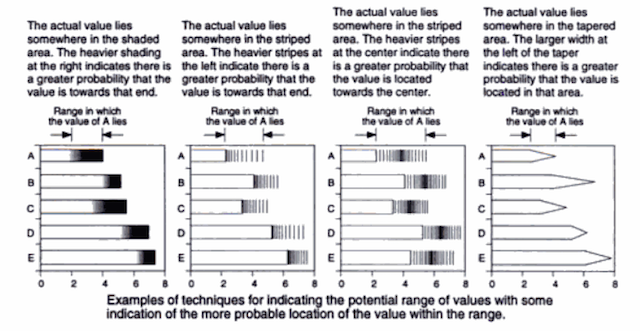
1. ‘Information Graphics: A Comprehensive Illustrated Reference‘, by Robert L. Harris. (I love the cigarette and pencil shaped plots here. Harris also refers to ‘Fuzzygrams’ but I’ve yet to get a full copy of his book to reach that chapter).
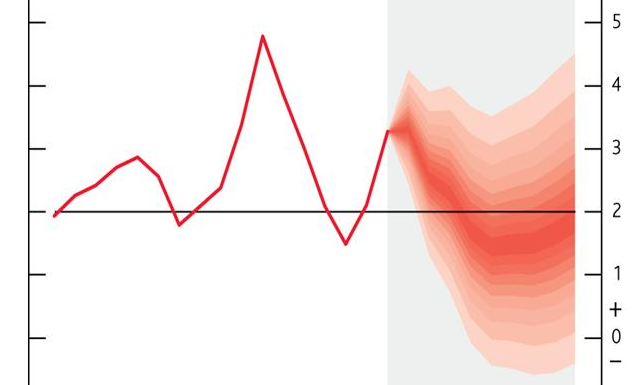
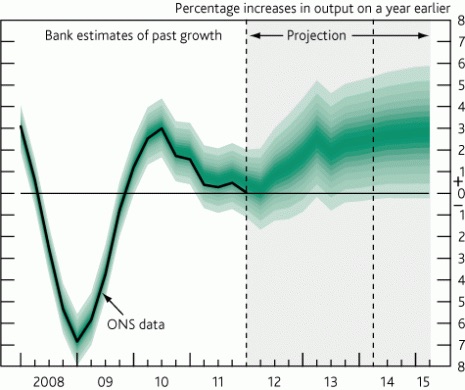
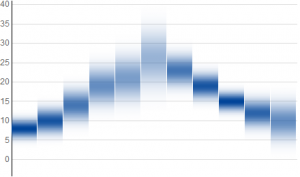
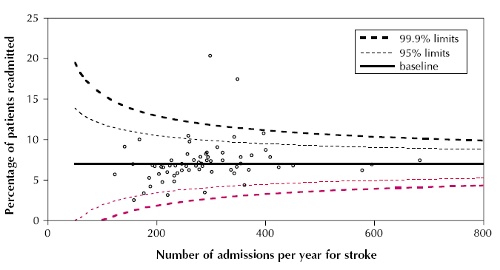
2. The Bank of England’s GDP fan chart profiled in a paper titled ‘Visualising Uncertainty About the Future‘, by David Spiegelhalter, Mike Pearson, Ian Short.
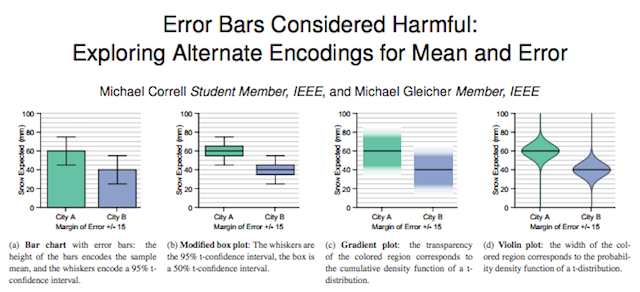
3. ‘Error Bars Considered Harmful: Exploring Alternate Encodings for Mean and Error‘, by Michael Correll and Michael Gleicher.
4. ‘Visualizing Data Uncertainty: An Experiment with D3.js‘, by Alex Krusz.
5. ‘A Review of Uncertainty in Data Visualization‘, by Ken Brodlie, Rodolfo Allendes Osorio and Adriano Lopes.
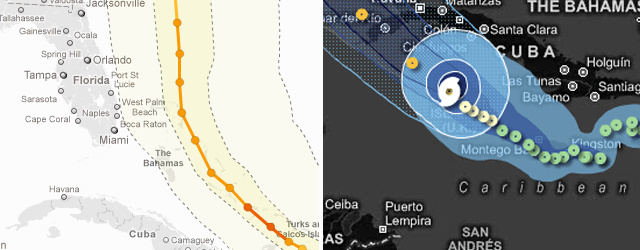
6. Contrasting Hurricane trackers from 2011 made by New York Times & Stamen used to track the uncertainty over the strength and direction of Hurricane Irene.
7. Case study: Visualising uncertainty on improving-visualisation.org.
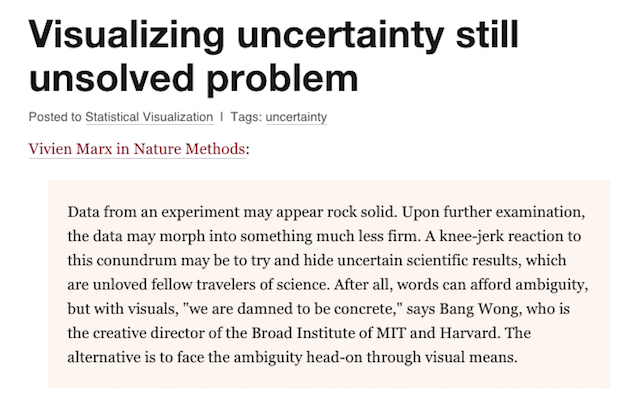
8. Some useful comments (one very detailed in particular) on Nathan’s post on FlowingData from 2013 ‘Visualizing uncertainty still unsolved problem‘
9. ‘From here to uncertainty‘, the UK Government Statistical Service’s guide to handling and communicating uncertainty

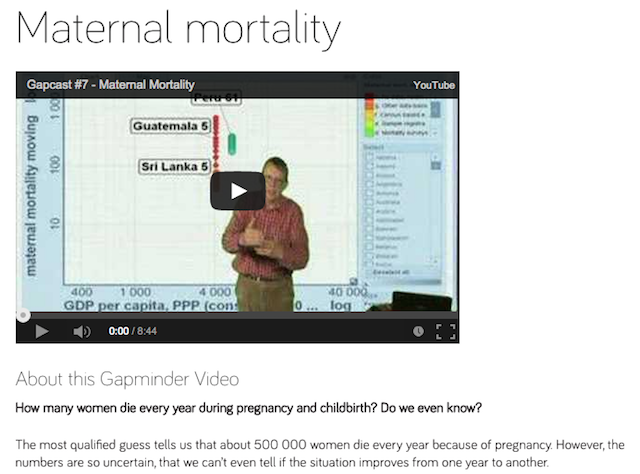
10. ‘Maternal mortality‘: A Hans Rosling Gapminder video concerning ‘How many women die every year during pregnancy and childbirth? Do we even know?’
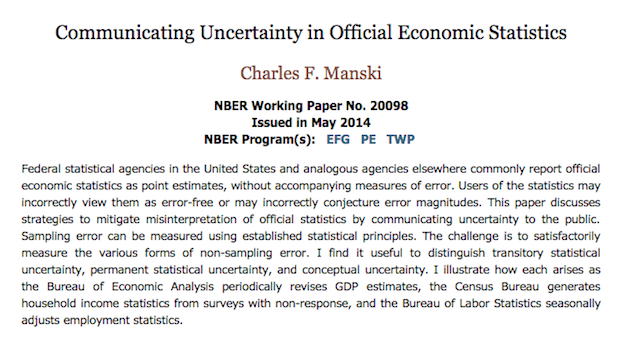
11. ‘Communicating Uncertainty in Official Economic Statistics‘, by Charles F. Manski
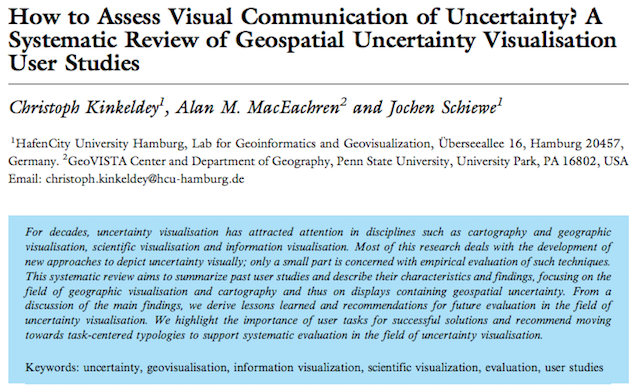
12. ‘How to Assess Visual Communication of Uncertainty? A Systematic Review of Geospatial Uncertainty Visualisation User Studies‘, by Christoph Kinkeldey, Alan M. MacEachren and Jochen Schiewe