
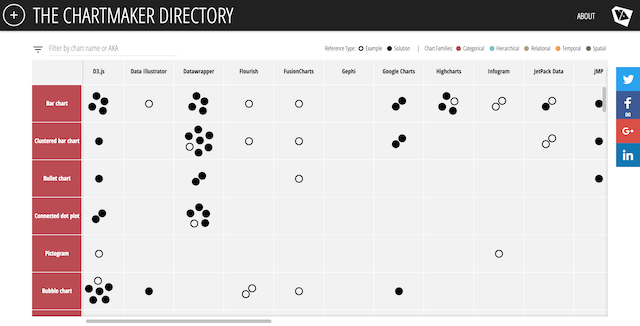
Last summer I launched the CHARTMAKER DIRECTORY, an attempt to gather and organise a useful catalogue of references that will offer people a sense of what charts can be made using which tools and, where necessary, how. Over the past almost-one year the contents have continued to grow and so I want to take stock on the latest situation (and remind you it is found via the link on my home page).
Thank you so much to all contributors and authors who have continued to grow the references in this directory up to a total of 847. I would be really keen to find more references to help plug the current gaps that exist with some tools that you just know have that capability. If you are an expert user or champion of any of these tools lacking examples/solutions please do add your work or references you know of to demonstrate that tool’s capability.
The tools included have evolved over the past year. Let me re-emphasise that the tools listed are not representative of ALL visualisation relevant tools, rather these are amongst the more common chart-making applications. As I have stressed before, note that some columns represent consolidated headers so that related tools can fall under one tool ‘family’ (eg. Qlik is all Qlik products, same with Tableau, R is now R and all related packages and extensions). There are a couple of tools listed that may, in due course, be removed as they don’t appear to have much traction or capability but that’s a hard thing to judge. I’m not wishing to bring an editorial slant to this, just make the directory as useful as possible to serve most peoples’ chartmaking needs.
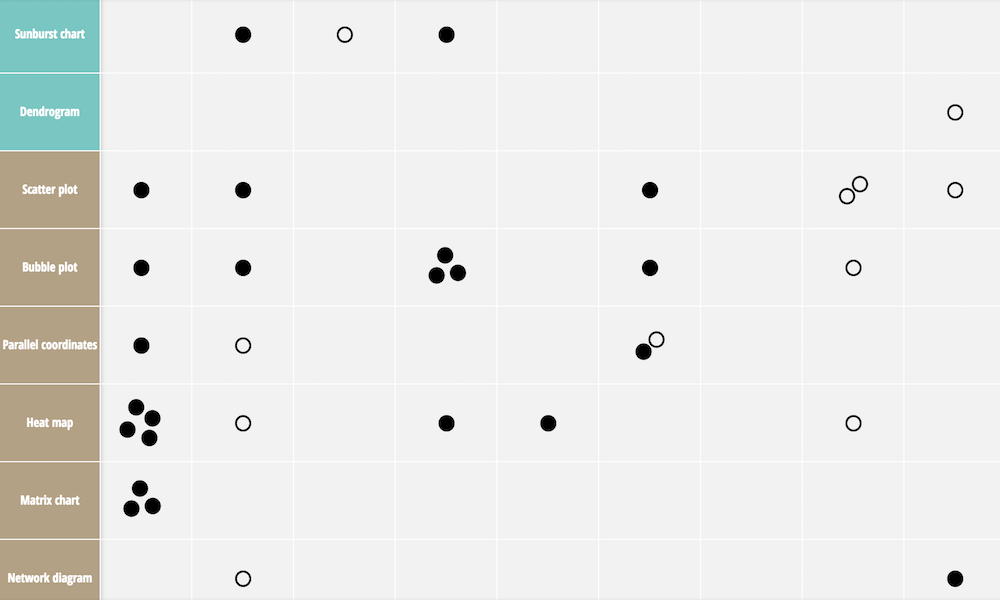
Here are some latest summary statistics, created using Datawrapper, about the directory’s contents: