
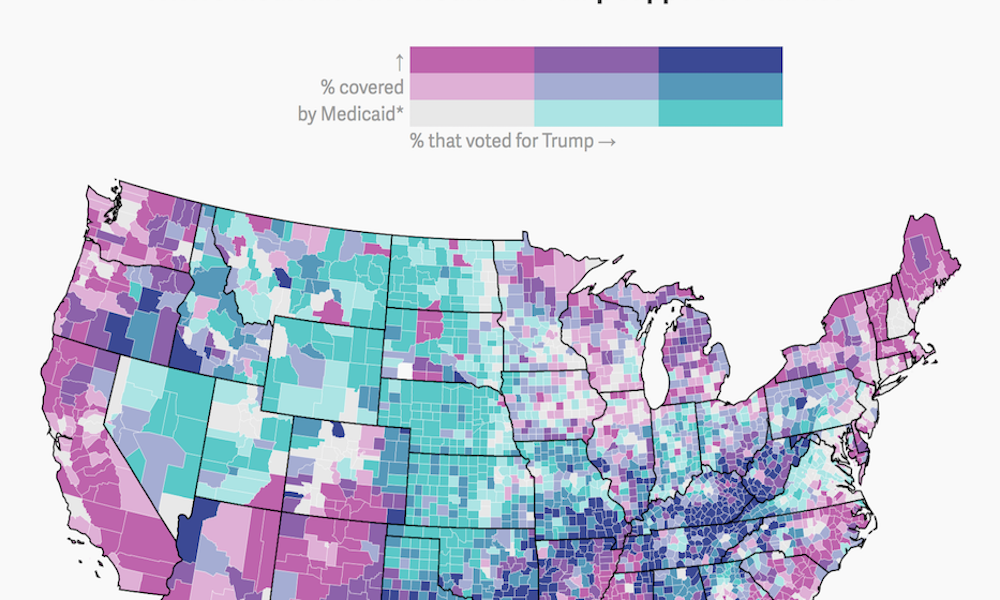
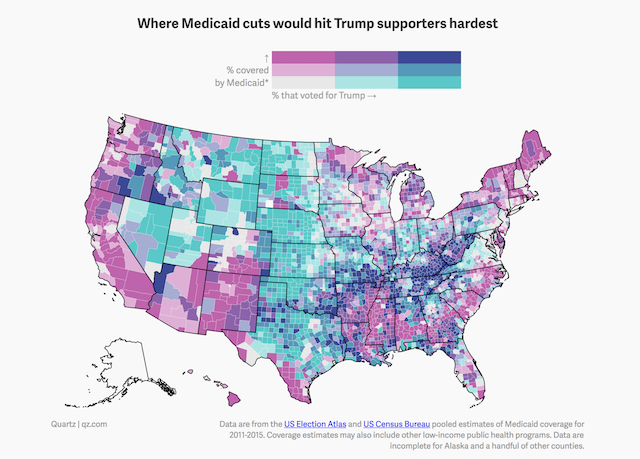
Yesterday, I came across an example of a bivariate choropleth map produced by Quartz. It isn’t an approach you see deployed too often so I was curious about what people thought about them on Twitter.
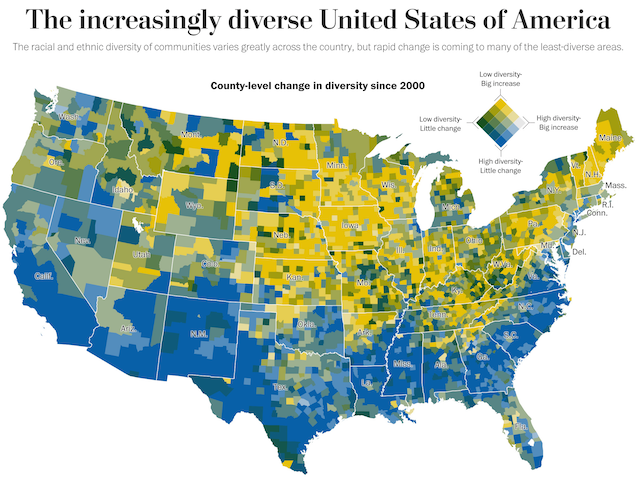
There were some interesting replies, with as many fans as there were doubters and also several who mentioned they’d never come across them approach before. The previous most recent example I’d come across was this from the Washington Post.
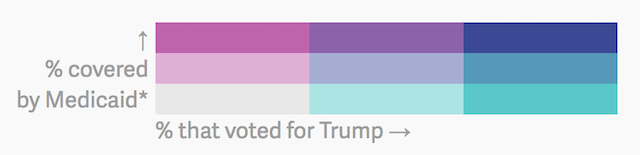
I thought I’d compile a quick post to share this technique with a wider audience and, principally, to point you towards a fantastic article written by Josh Stevens from 2015 in which he brilliantly explains their role and value (as well as a ‘how-to’ guide). As Josh explains, this technique involves simultaneously plotting two quantitative variables on a map. To achieve this, the two variables are split into (typically three) intervals/bins and then a matrix colour scheme is formed out of mixing the two univariate variable scales. Typically, you’ll see these as a 3×3 grid, as shown below.
My immediate feeling is that each time I have encountered a bivariate choropleth I have found it a challenge. Though I admire the intent I find the task of parsing the mix of colours quite effortful. That said, as with many charts, simplicity and immediacy are not always a relevant aim. The audience characteristics, the communication setting, the subject matter, and the complexity of the phenomenon being plotted are just some of the classic circumstantial factors that will have more influence on whether requesting effort from your audience could be proportionate and justified.
So, how can you make these as accessible as possible? I feel the key design factors include the following:
1) The two variables plotted should have a reasonable/logical relationship to make the overlapping colour states meaningful (eg. dominance of voting % for democrats vs republicans, the mixed state demonstrates even split)
2) As the eye struggles to contend with many colour classes, it seems important that the colour combinations used are supported by written explanations to describe what each colour/mix means
3 a) Providing interactive filtering to emphasise individual colour mix components
3 b) Providing interactive annotation through tooltips can be a useful aid to help orientate your eye for the colour meaning of the values portrayed in each location (A couple of examples: this and this)
4) Accompanying the main display with separated small multiples of the univariate plots is advantageous
