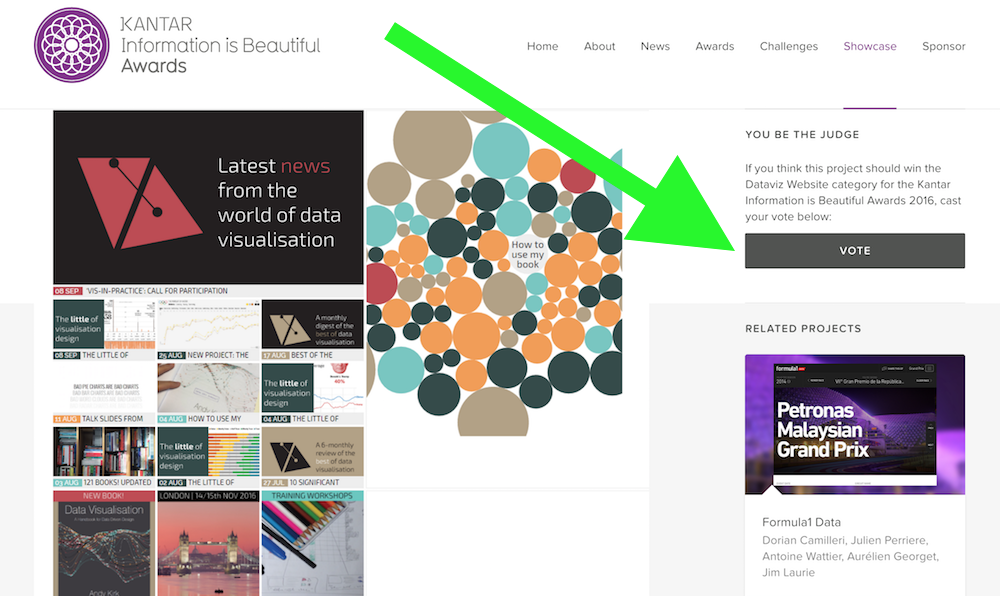
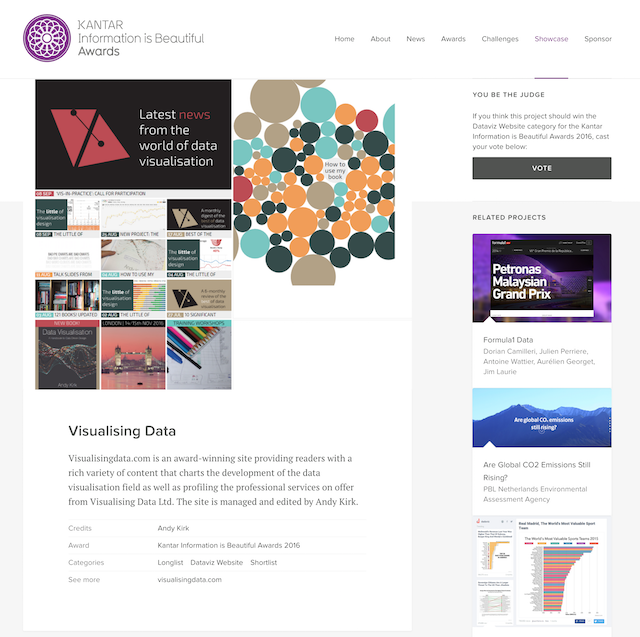
Last year I was delighted to that visualisingdata.com was awarded the winning prize in the best ‘Dataviz website’ category of the 2015 KANTAR Information is Beautiful Awards. One year on and I’m very grateful again for the kind people out there who have nominated my site to be shortlisted again for the 2016 award (naturally, in the same category).
I should maybe be content with the 2015 award but I’m not: I want more! Site visitors can help by voting for the site and their votes will be tallied alongside expert judges to establish the final award rankings. Here’s a simple 3-step strategy:
(1) Visit the award profile page on the KANTAR Information is Beautiful Awards site.
(2) Hit the grey “VOTE” button on the right
(3) Pat yourself on the back for possessing such good judgment
(Here’s the small print: You can only vote once in each category and once you’ve voted that’s it – you can’t change your mind. You have until Tuesday 11th Oct at 23:59 PST to vote. The public vote gets added to the decisions from our 30+ expert judges.)
However, rather than just emptily ask for your generous support, I thought I’d just offer a quick recap of some of the highlights and popular content that has been published on the site during this past year:
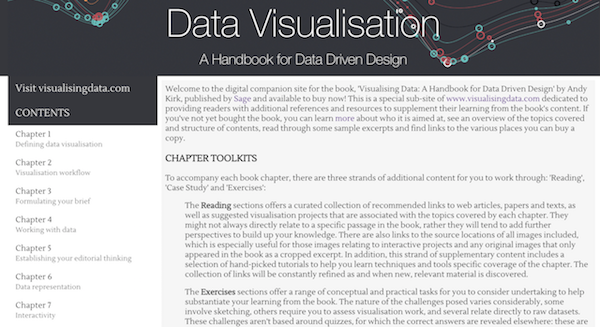
My new book’s companion site
Book prize contests: #Graphiti, #BestWorst, #BookShopped
The ‘LittleVis‘ series (now up to 26 posts)
The ‘Six questions with…‘ series (now up to 26 posts)
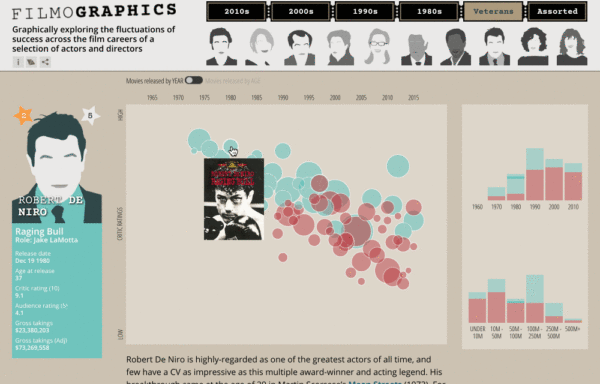
New design projects: Boom and Bust, Filmographics, Pursuit of Faster ’16
Several slidedecks/videos from conference/webinar talks
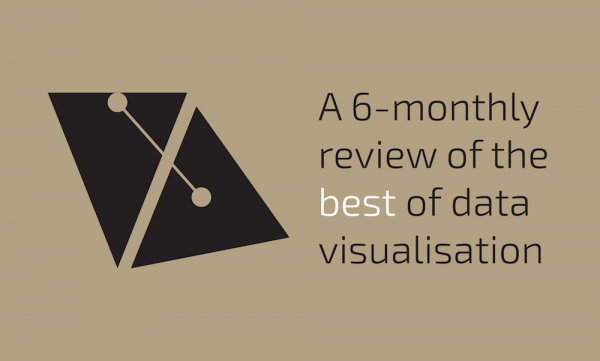
6 years and still going… The ‘best of…‘ monthly and 6 monthly collections
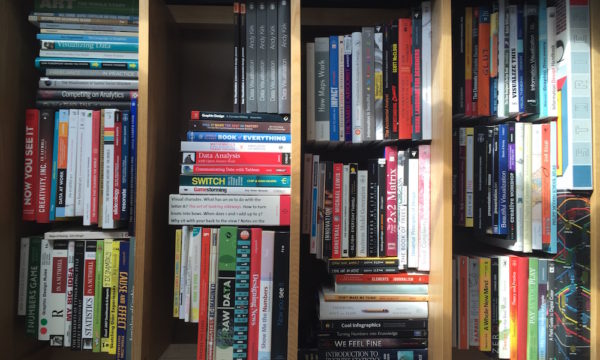
Updated collection of 122 data visualisation books
Updated collection of 304 data visualisation resources