
In order to sprinkle some star dust into the contents of my book I’ve been doing a few interviews with various professionals from data visualisation and related fields. These people span the spectrum of industries, backgrounds, roles and perspectives. I’ve only scratched the surface with those I have interviewed so far, there’s a long wish list of other people who I haven’t approached yet but will be doing so. My aim is to publish a new interview each week through to the publication of my book next year so look out for updates!
I gave each interviewee a selection of questions from which to choose six to respond. This latest interview is with John Burn-Murdoch, Data Journalist at the Financial Times. Thank you, John!
Q1 | When you begin working on a visualisation task/project, typically, what is the first thing you do?
A1 | I open up two tabs in Chrome, one with the web inspector set to a mobile display. I was way too late to start doing things this way, but I can’t stress how important it is to walk the walk when it comes to designing for ‘mobile first’. At the Financial Times 40 per cent of our readers land on stories in a way that makes non-responsive interactive graphics completely invisible. A further ten percent will see the graphics, but will be using a smartphone or tablet when they do. So in total that’s half of our entire audience who will only see or be able to comprehend our work if it’s designed for viewing — and using — on a small screen.
In the bad old days I would design and preview a graphic on desktop and then have a late dash to get it in a mobile-friendly layout. There were three major problems with this (as well as countless minor ones): first, this meant I was actively treating non-desktop users as second-class citizens; second it added time to the end of the design process; and third it meant I never had the joy of discovering all manner of design and user experience (UX) tricks and techniques that you never really encounter on desktop, but that can be used to great effect across all devices.
Q2 | With deadlines looming, as you head towards the end of a task/project, how do you determine when something is ‘complete’? What judgment do you make to decide to stop making changes?
A2 | At the risk of sounding clichéd, for me this is about treating a visualisation as a story. You want the user to finish exploring or navigating through your graphic and feel that they’re reached the end. And not in an abrupt, “oh.” kind of way, but with the satisfaction that comes with completing something.
And the story analogy also has other levels that I think are particularly applicable to data visualisation. One is the fact that a story can end on a cliffhanger just as it can end with a ‘happily ever after’. Sometimes, particularly in journalism, you want your audience to leave a visualisation with more questions of the subject matter than they came in with. “Why is that point such an outlier?” “Why are those two paths so similar?” etc.
A second is that often when you’ve finished a story that you’ve been particularly engrossed in, you pore back over its pages (or skip back to earlier scenes) to see if there was a detail you missed, or to explore a key point in the narrative. For me, allowing for retrospective exploration is equally central to the process of creating a journalistic visualisation. Sometimes the explorative step means explicitly adding a step to the end of an interactive or animated graphic letting the user delve deeper into the theme to which they have just been introduced. Other times it means creating a static graphic with sufficiently distinguishable layers of information that the user is both drawn into it by its initial, macro-level message, and is then held there as they dig deeper into the information it contains, exploring micro-level patterns and points.
Q3 | How do you mitigate the risk of drifting towards content creep (eg. trying to include more dimensions of a story or analysis than is necessary) and/or feature creep (eg. too many functions of interactivity)?
A3 | I recently read Luke Miller’s excellent book “The Practitioner’s Guide To User Experience Design”, which is a fantastic and detailed guide to user interface (UI) and UX design, as well as touching on elements of digital product development and project management. Among its many maxims and techniques that stayed with me were the idea that a product — in this case a data visualisation — is complete not when nothing more can be added, but when nothing more can be taken away from it.
At the time this approach certainly did not describe my process, and upon first reading I seem to remember thinking that line was a bit too glib for my liking, but with the aid of a couple of months’ hindsight, it has proved one of the most valuable insights I took from the whole book.
Now, instead of wondering whether I could add a button here, a slider there, perhaps an extra interaction between this thing and that thing, I try to build the most intuitive visualisation I can that fulfils its purpose, with the fewest user-inputs possible. Lest this read as hubris, I’m sure any UX designer who has seen my work will tell you I’m still very much setting out on this road, but I already feel it has helped enormously.
Switching from feature creep to content creep, I think the process is no different in visual journalism than it is in journalism journalism. A graphic can be rambling or can leave you thinking ‘tl;dr’ just as can a story told entirely through text, and it’s the job of a visual journalist to make sure the reader doesn’t switch off halfway through but comes along for the whole ride. Again this is a line I’ve been on the wrong side of plenty of times, but it’s a line I’m only growing more acutely aware of, and hopefully those cases will become ever more clearly exceptions to the rule, rather than the rule itself.
Q4 | We often hear how important ‘designing for an audience’ is but this is often easier said than done. How do you integrate this perspective of thinking into your own workflow? Do you have advice on any effective approach(es) you use for this?
A4 | In my experience the issue of designing for an audience is more an issue of designing for multiple distinct audiences at the same time. This is a major challenge, but one to which there is — I think — a solid enough solution in the form of a rule to follow. I’m not saying it’s easy to follow, but at least we have it as a framework within which to work. As I see it, you want to meet two criteria: first, your graphic must be sufficiently eye-catching to a non-expert who just happens to glance at it, and sufficiently interesting to hold their attention and leave them feeling confident to tell others what they learned from it. But second, it must satisfy those who already have expert knowledge of the topic, depriving them of any reason to complain about things being ‘dumbed down’.
For me the best way to do this is to refer again to the concept I mentioned earlier — that of layers of information. Ideally you want a non-expert user to be able to transition from the ‘core message’ view of your graphic to the ‘informed exploration’ phase, but underpinning this is the need for two such stages to exist. Even if a non-expert only ever feels the graphic is telling the story’s top line(s), and the expert only ever sees it as a tool for detailed exploration, the very fact that two such different groups can depart the same graphic feeling they completed a self-contained journey is a sign that it has dealt with the audience challenge.
A second point on this relates specifically to my time at the FT, and to one piece of data visualisation in particular, exploring — of all things — the speed of elevators in skyscrapers. On the one hand we had this great idea of doing something fun — animated lifts racing up and down buildings while the user was on the web page. But on the other hand This Is The Financial Times and that carries with it a responsibility to do things in a certain way. So we spend time illustrating and designing to give the graphic high production values, and it was then presented alongside an excellent piece of journalism from our manufacturing correspondent Tanya Powley, on the high-speed elevator industry, The result? An undeniably fun user experience, but delivered in such a way that met FT subscribers’ standards for high quality visuals and high quality journalism.
Q5 | For a potentially multi-faceted story/subject, how do you arrive at a judgment of what will be the most interesting and relevant slice of analysis to focus on for a visualisation/infographic? What specific attribute of journalistic experience and skill do you think helps you to achieve this?
A5 | This is another case in which I think the distinction between journalism of a visual variety and its other forms is largely false. In any form of journalism you are tasked with identifying the top line of your story (or graphic) as a means of selling it to potential readers. ‘What element of this story is going to persuade somebody to read it?’
Especially relevant here is a quote from Hans Rosling, who I credit with first inspiring me to use animation as a narrative technique. He describes the task of a data journalist thus: “You have to be like the worst tabloid newspaper in the front and the Academy of Science in the back.”
In the context of choosing the focus of a visualisation, I see this as telling me that provided the story I am telling is grounded firmly in rigorous and peer-reviewed** analysis, my focus can then be completely on how I present it for maximum eyeballs-on-screen impact.
And after all, what is more British-Tabloid-front-page-lead than highlighting all costs how much a story affects YOU?
One simple way of doing this is to ask the user for some information about themselves — perhaps their address, or their age — and then surface a view of the graphic that is of special relevance to them. And today the tools available to digital journalists allow us to go even further, such as in a recent example where the New York Times automatically detects the user’s rough location (where the user’s browser settings allow this behaviour) and then tailors both graphic and story to them on this basis.
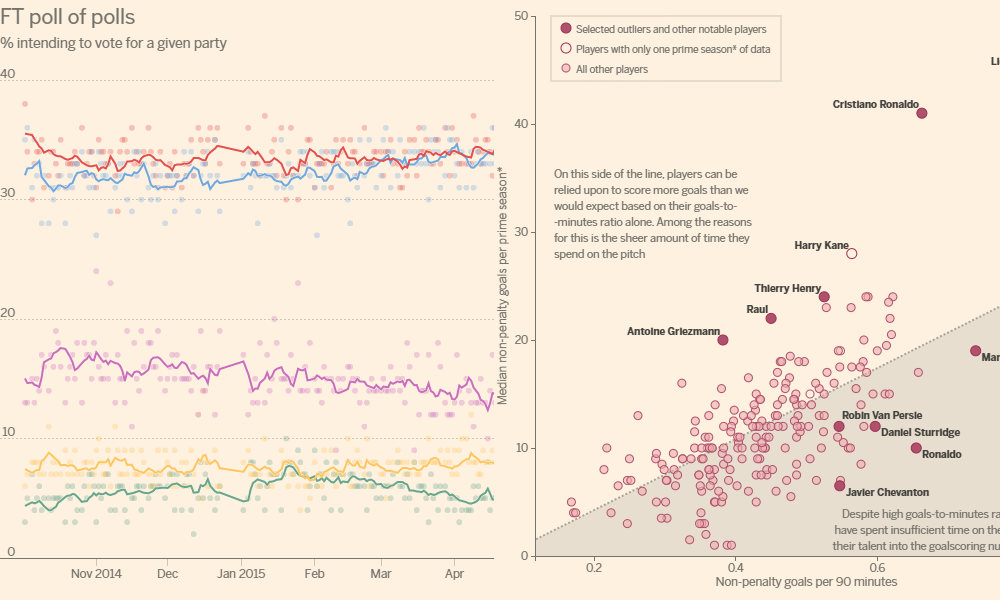
Even when, for whatever reason, it isn’t possible to take a guess at the user’s location, or where a graphic’s subject matter does not lend itself to this kind of personalised approach, said graphic’s inherently visual nature gives you the edge over a text-only story: you can use an image of the key person/place/object to immediately harness attention, for example by illustrating or otherwise highlighting one or more well-known people or places on the first view of your graphic that a user will see. Instantly, even somebody with little-to-no knowledge of the subject matter stands a greater chance of recognising these data points and therefore has an instant frame of reference for the rest of the visualisation.
**Peer-reviewed in the ‘my work has been reviewed (thoroughly checked) by my peers (colleagues)’ sense rather than the scientific journal sense.
Q6 | As you will fully appreciate, the process of gathering, familiarising with, and preparing data in any visualisation/infographic design task is often a sizeable but somewhat hidden burden – a task that can occupy so much time and effort but is perhaps ultimately invisible to the ultimate viewer. Obviously, pressures during this stage can come in the shape of limited timescales, data that doesn’t quite reveal what you expected and/or substantial data that offers almost too many possibilities. Have you got any stand out pieces of practical advice to share about your practices at this stage?
A6 | Preach! The data gathering, cleaning and analysis stage of any visualisation is massively understated, but there are dozens of brilliant tips, tricks and broader strategies out there if you can track them down.
Here are a handful of the ones I have found most helpful:
1) You should almost always start with the pull of journalistic curiosity (a hypothesis, relevant news story, line of questioning etc), not the push of a rich dataset. While it may sound like having a particularly detailed or big database sitting in front of you is, like, the best thing ever for a data journalist or data visualisation practitioner, it’s pretty much the opposite of the truth. Even before the process of cleaning and analysing the data can begin, there’s the elephant in the room: what am I looking for here? In my experience this is almost always the most inefficient period in the whole process. Give me a question and no data over data and no question any day. The first problem is almost always easier to solve.
2) Picking up from where I left off on point a) – learn how to scrape the web (but make sure you have permission to do so before diving in!). Once you’ve mastered scraping, be it with a programming language such as Python or R, or software such as Import.io, Kimono Labs or OutwitHub, everything gets easier and less time consuming. First of all, those times where you have a question but no data? Not for long. And second, found that list of lists of lists on Wikipedia that contains the information you need? With a robust scraper up and running you can go out and, like, do human being stuff while your dataset takes shape, instead of copying and pasting for days on end (I feel queasy just thinking of the times I seriously used to do that).
3) Think big and small. Sometimes your top line will come from a population-wide statistic — a change in the whole dataset’s sum, average, range etc. Other times it will be in a single row, or even cell. You might be tempted to ignore the big stuff because it’s too zoomed-out or abstracted from people’s real-world experience, but you might miss the story in doing so. Equally it might be tempting not to faff about with all the individual values and instead focus on the bigger picture, but again you might miss the killer line.
4) Finally, be sceptical of your data and of your analysis. Whether a dataset was delivered to your desktop in pristine condition, scraped from multiple web pages across multiple sites, or assembled in some other way, it could be flawed. That flaw could be a spreadsheet error or a typo, or something less tangible such as a bias — intentional or otherwise — in how the raw data was collected. And the blame doesn’t stop with the data. Have you understood that column heading correctly? Are those two datasets you’ve combined both using the same definitions for the numbers you’re summing/comparing? Does that empty cell mean zero, or missing data? Can you fill in that missing data gap with a few minutes of your own research? Question your raw data, question the organisations who gathered it, question the steps you’re taking to go from data to story.
5) I know I said finally, but on the topic of questioning ‘the steps you’re taking to go from data to story’, I highly recommend using a programming language such as R or Python to carry out data cleaning and analysis, over out-of-the-box tools such as Excel. And I don’t say this out of some kind of open-source snobbery, I say it because I used to do everything in spreadsheets, and thankfully I was bullied teased enough by our awesome newsroom developer-journalists at the FT to kick the habit (I now predominantly use R for gathering, cleaning and analysing data. Oh and some visualising data as well). Once upon a time I had documents setting out the steps I would need to take in a tool like Excel to update or analyse a particular dataset. Now I just re-run an R script. Once upon a time if someone asked me how I had gone from the raw dataset to the figure in my headline or graphic, I would have to painstakingly repeat every sort, filter, sum and pivot table to go from A to B. Now I just read through the R script.