When observing the trajectory and development of the data visualisation field I often contemplate the dual role of the scientific and creative communities: I believe scientists tell us what we should do and creatives tell us what we could do. Alone, the field leans towards one direction but together they take us forward in the most positive direction.
In the past few days I’ve come across nice examples of both communities in action and thought I’d summarise them in a combined post. Firstly two examples of innovation from creative thinkers and then two valuable products of research from scientific minds.
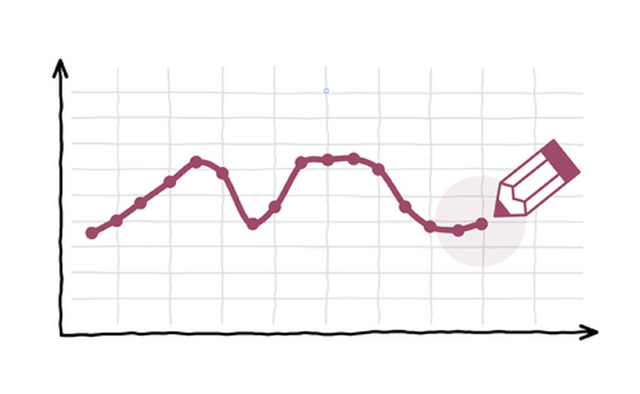
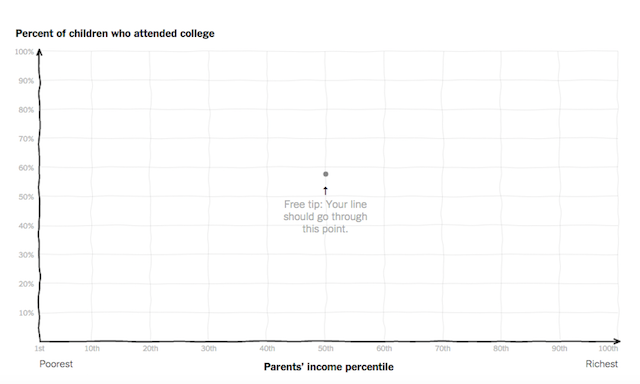
‘Draw your chart’, The Upshot
Today we have seen a terrific demonstration of the compelling nature of participatory visualisations. Amanda Cox, Kevin Quealy and Gregor Aisch from TheUpshot have launched a brilliantly engaging ‘draw your own chart‘ project that allows users to draw a line chart that you feel represents the shape of how family income affects children’s college chances. Not only that, but depending on the ‘fit’ of the line you draw (and I won’t share a screen grab of my guess and ruin the surprise) the resulting text is customised to comment on how well or poorly you did, compared to the actual and to everyone else.
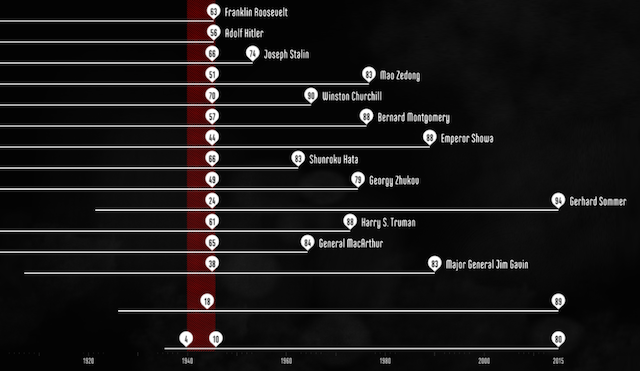
‘The Fallen of World War II’, Neil Halloran
This is a fascinating looking interactive documentary by Neil that “examines the human cost of the second World War and the decline in battle deaths in the years since the war”. It exists as a 15-minute video visualisation using “cinematic storytelling techniques to provide viewers with a fresh and dramatic perspective of a pivotal moment in history”. The mix of video-based explainers and interactively explorable charts is typical of a slowly emerging recent trend to combine experiences. I’ve only had chance to watch the first minute or so but it is already clear that its an excellent piece of work.
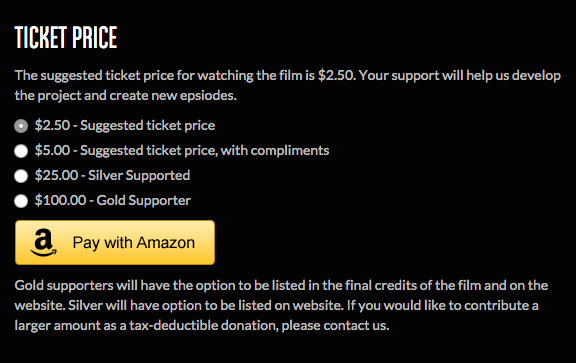
A second interesting innovation is the use of an optional ‘ticket’ payment system presenting the possibility for viewers to contribute a small fee for the benefit of watching – “support will help us develop the project and create new episodes”. We see different approaches of revenue generating from upfront kickstarter type models, paywalls in journalism, and advertising space so why not offer an optional charge? People have to earn a living!
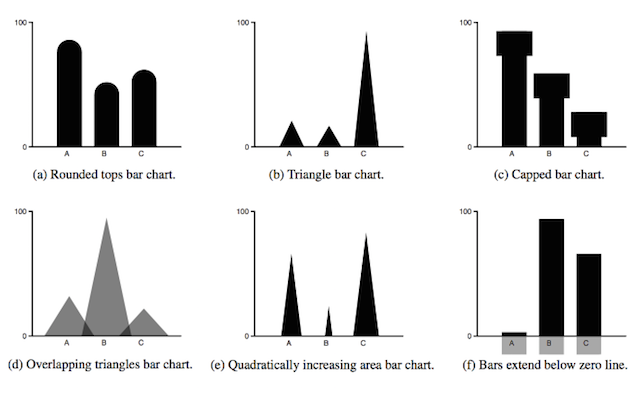
New Paper: ‘Impact of Visual Embellishments’
This week at EuroVis, Robert Kosara, Drew Skau, and Lane Harrison are presenting their new paper “An Evaluation of the Impact of Visual Embellishments in Bar Charts“. The title is self-explanatory so I won’t just rehash the entire abstract but this is a really valuable piece of research that offers evidence to support what we might otherwise need instinct to rely on. It also means there is a robust argument to rightly dismiss those dreadful triangle shaped bar charts.
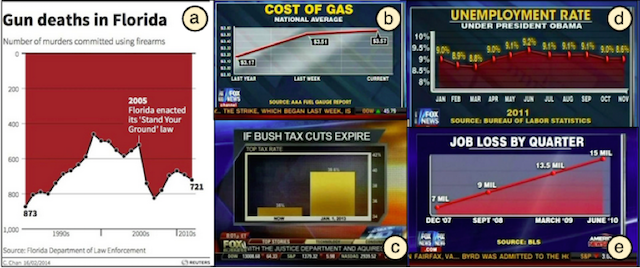
New Paper: ‘Deceptive Embellishments’
This one goes back to late February, but I wanted to bring balance to this piece. Enrico Bertini, Anshul Vikram Pandey, Katharina Rall, Meg Satterthwaite and Oded Nov published a paper “How Deceptive Are Deceptive Visualizations?“. This study explored a range of classic deceptive visual distortions and tested out the impact they had on readers. Once again as you might imagine, the results show the deceptive devices we have always warned against genuinely do have the distorting influence we suspected. Like the paper above, this is another valuable and practical piece of empirical evidence to support good visualisation practices.