Might be a little late to this but I have been exploring the absorbing ‘The Library Project’, a collaboration between the Spatial Information Design Lab at Columbia University, led by Laura Kurgan, and visualisation design/developers Annelie Berner, Jen Lowe and Derek Watkins. The motivation for the project is framed around a desire to create a way of ‘comprehending the immensity, character and value of the collection’. As more data about the library’s collection becomes digitised, these tools enable a novel means of exploring the shape, dynamics and relationships that exist amongst the vast collection.
The project, split into two displays, visualises the Columbia Libraries collection in one interactive interface and then explore connections between the books based on subject connections in the other.
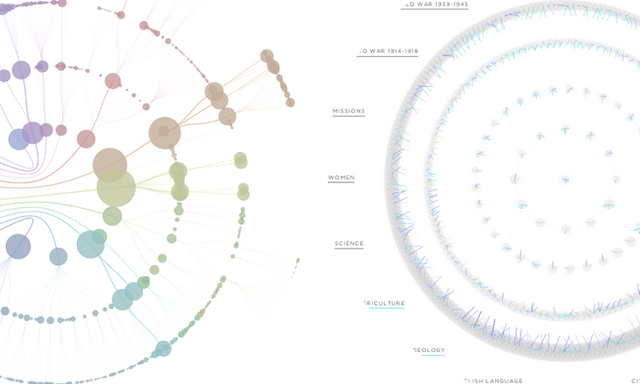
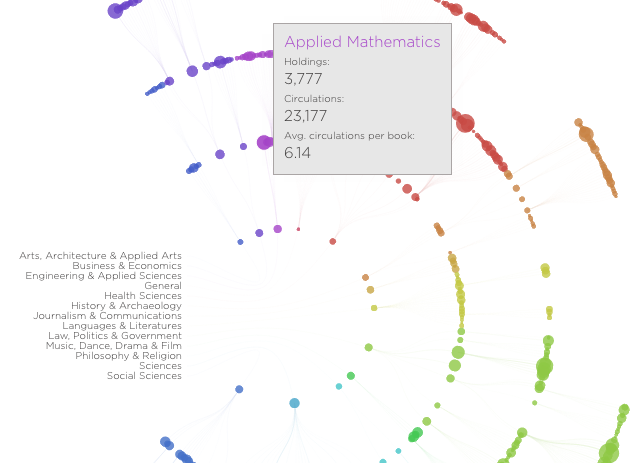
Catalog, ‘a visualization of the Columbia Library’s holdings, circulation and activity’, is the first of these displays, presenting a radial tree structure of the taxonomy of book subjects. On the inside are the major categories, moving towards the outside gets into more specific topics. The size of the circles indicate one of three quantitative metrics: total books held, total circulation and then a relative ratio of the two for context.
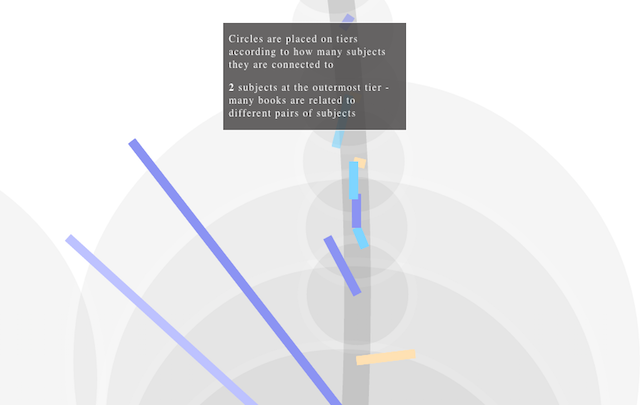
Crossing Disciplines, ‘a digital library tool for multidisciplinary exploration’, is the second display, offering a tool to explore the “books in the Columbia University Libraries that are at the intersection of two or more disciplines”.
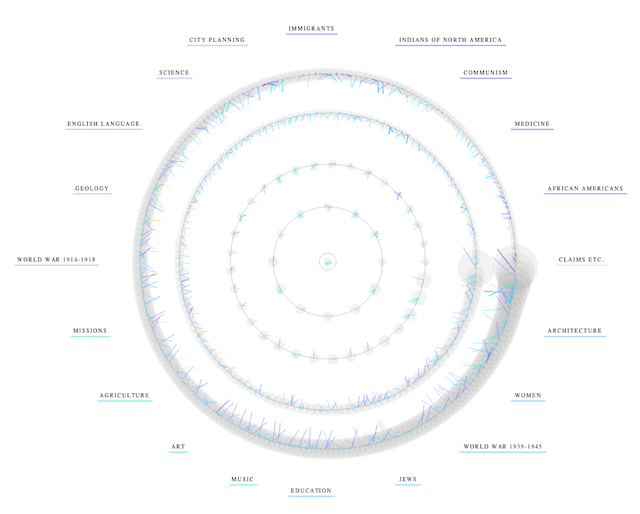
This has a bit more interactivity going on with the ability to select two or more subjects around the ring of the top 25 most interdisciplinary subjects in the library and then use the mouse wheel to zoom in or out of the display.
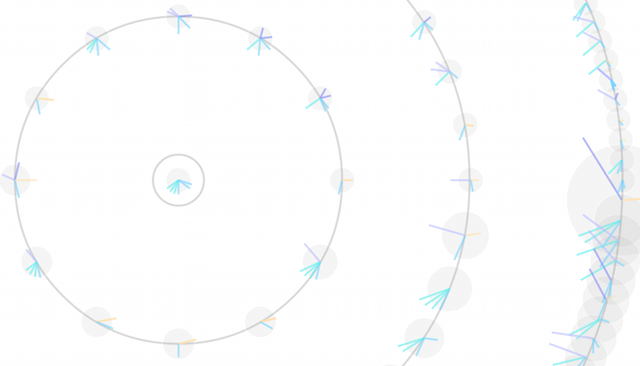
There are a couple of really nice design features here. One is the way the display gives you a short preview of the connections that exist but without cluttering the entire display.
Secondly, there is a guiding tutorial to take you through the intricacies of the interactive one feature at a time. Really useful to ensure users get the most out of interrogating it.