
As the final members of the graphics teams (1, 2, 3, 4 etc.) across the news media finally shut down their machines after a long night of mid-term election coverage, I am reminded of a great article by Matt Ericson from 2010 titled ‘When maps shouldn’t be maps’. (Addition: A very helpful ‘Map or Don’t Map‘ flowchart from John Nelson at IDV)
In this article Matt describes the need to be more challenging in our natural assumption that simply by having spatial data we should map that data: “the impulse is since the data CAN be mapped, the best way to present the data MUST be a map”. If the interesting patterns are not spatial then a mapped display is fairly redundant. We may learn more from a location-categorical display comparing quantities or how values for those locations have changes over time, ranked by the largest to smallest changes, for example.
However, on the flip side, when the interesting patterns ARE spatial, then of course, the layering of a data display on to the apparatus of a ‘map’ makes complete sense. Over the past week I have come across two different but very effective examples that demonstrate this.
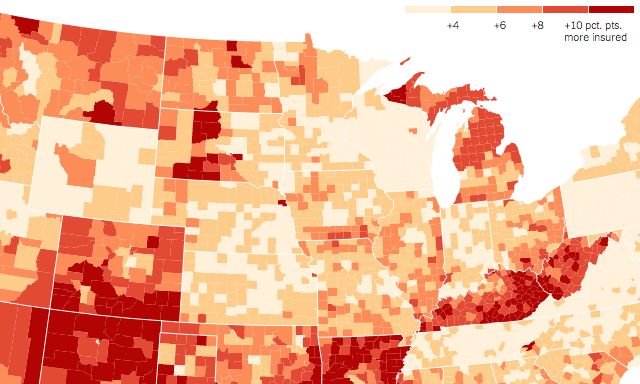
Firstly, a very revealing visualisation (Alberto’s viz of the week, no less) about ‘Obama’s Health Law‘ by the New York Times. The map displays the percentage point increases, county by county, of Americans with health insurance under the Affordable Care Act.
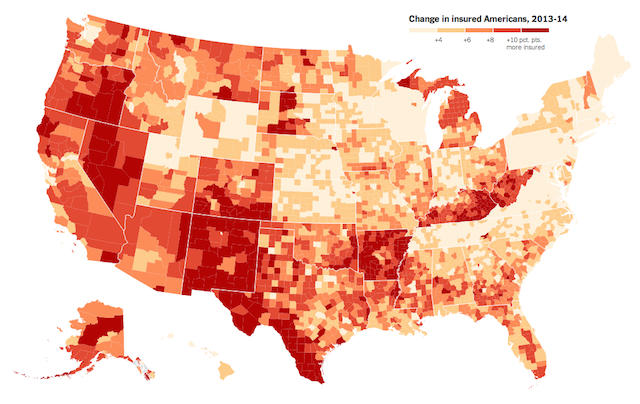
I don’t know a great deal about the Affordable Care Act, particularly the political mechanisms that make it available or otherwise, but from looking at the display you can immediately see regional discrepancies that MUST be reflective of state level policies. Reading the accompanying article explains this observation in further detail:
That state boundaries are so prominent in the map attests to the power of state policy in shaping health insurance conditions. The most important factor in predicting whether an American who had no insurance in 2013 signed up this year was whether the state that person lives in expanded its Medicaid program in 2014.
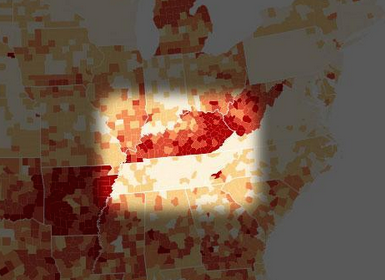
By way of illustration, the piece draws contrast between Kentucky, which expanded Medicaid, and Tennessee, which didn’t. This was something highlighted by Lena Groeger on Twitter
There are many other spatially significant differences that support the benefit of displaying this data (albeit, just one view or one slice of analysis about that data) via a map: It reveals interesting patterns that would not have been as effectively or efficiently portrayed using other approaches.
The second example I came across concerns a different idea of mapping, this time the mapping of the geography of the human body. The graphic ‘Bumps, Bruises and Breaks’ by the Wall Street Journal – originally found on Junk Charts – shows how NFL players have sustained over 1300 injuries this season and where these injuries occurred on the body.
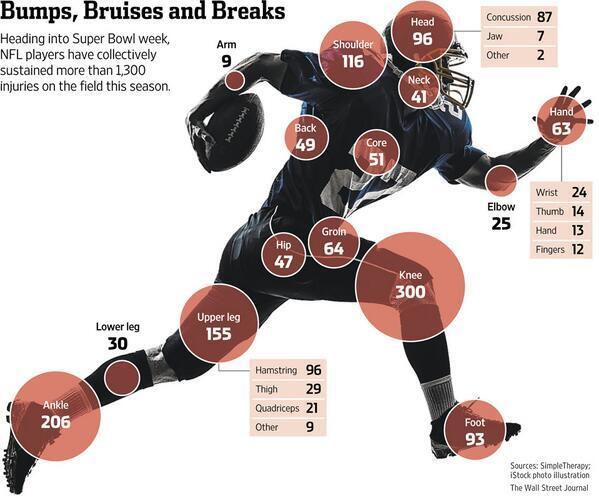
Plotting the quantitative displays of injury totals across the different parts of the body makes complete sense. It is more concrete, you can see the distribution more instantly. By having the illustrated player in the background you can also draw conclusions about the sufficiency (or otherwise) of the protection they get from their kit. Incidentally, Kaiser does a great job of offering up some further enhancement ideas for the graphic.
So in conclusion, just because you can map your data, doesn’t mean to say you should. Have the discipline and sense to challenge your natural impulses but, when it does make sense to do so, plotting spatial data on a map can really illuminate the inherent patterns.