
Earlier this year I profiled the success of participative visualisations, visual projects that go beyond interactive interrogation to invite the user to put themselves at the heart of the subject’s data. This piece primarily focused on the amazing impact of the New York Times’ dialect map/quiz but I also referred to some of the projects the BBC have worked on over the past few years, such as the Olympic athlete body match app. Today they have published another interesting participatory project titled ‘Your Life on Earth‘.
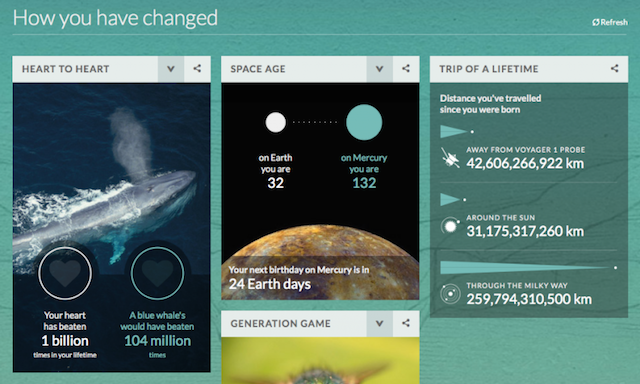
Developed by the team at David McCandless’ IIBStudio, this work puts your life on Earth into numerical context displaying how you and the world have changed since you were born.
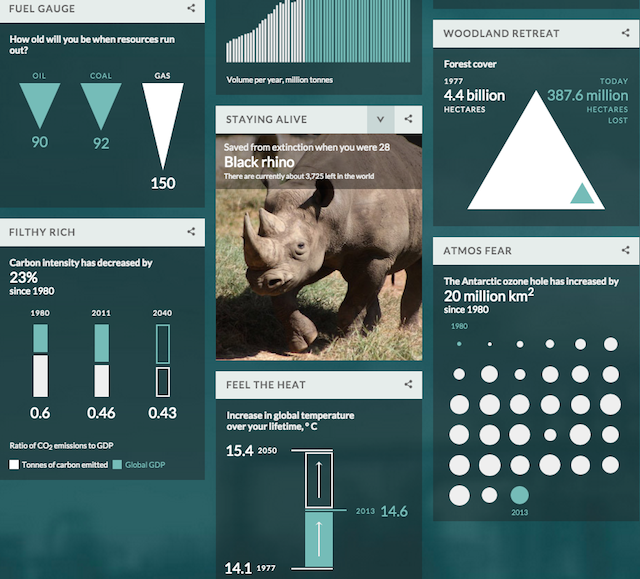
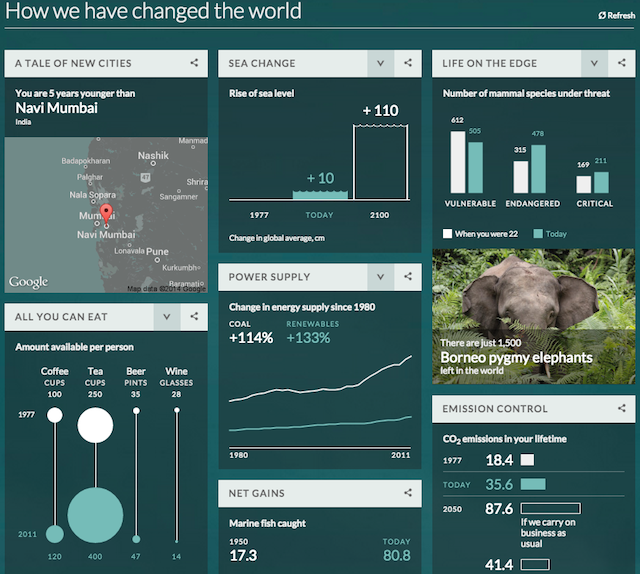
The project is presented in 4 sections: ‘How you have changed’, ‘How the world has changed’, ‘How have we changed the world’ and ‘How the BBC captured it all’. It includes analysis such as how many times your heart has beaten, and how far you have travelled through space, the number of earthquakes and volcanoes that have erupted in your lifetime and how many species we’ve discovered and endangered.