

One of the (many) things that impresses me most about the quality of data visualisation and infographic output from the leading journalist organisations is the continued variety and innovation of their techniques. Rather than just being constrained by a limited visual vocabulary, each new work published tends to feature a solution uniquely suited to the data, the analysis and the subject matter involved. Given the pervasive time constraints involved, the work we see created, day in day out, is quite incredible.
Of course, on special occasions, there is a compelling reason to potentially re-cycle previously used graphic archetypes and there was an example of this last week that was both astute and highly impactive.
Firstly, to explain what I mean by re-using custom graphic archetypes. I’m not talking about the repeated use of an off-the-shelf chart on numerous separate occasions, like the bar or the line chart, I’m referring to more bespoke solutions that have been used for multiple projects.
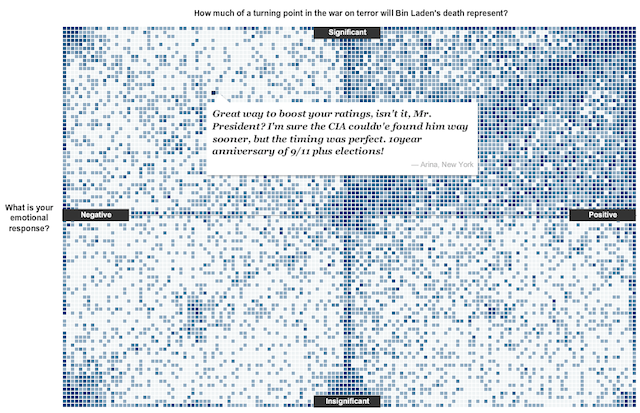
The New York Times, for example, utilised this interactive and participative matrix to assess the public’s reaction to the death of Osama Bin Laden back in May 2011.
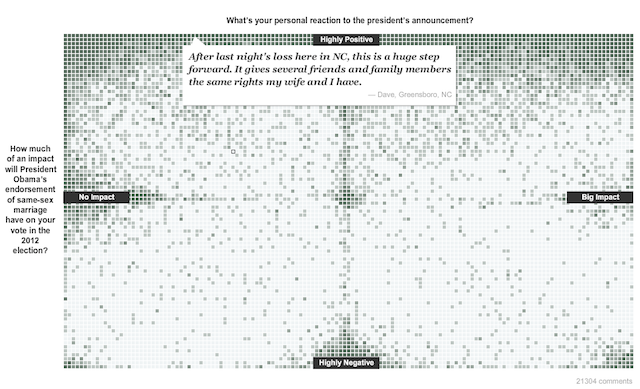
They then, quite correctly, used the same underlying graphic approach to assess the reaction to Barrack Obama’s stance on same-sex marriage. Why reinvent the wheel when you’ve got a perfectly applicable solution on your shelf?
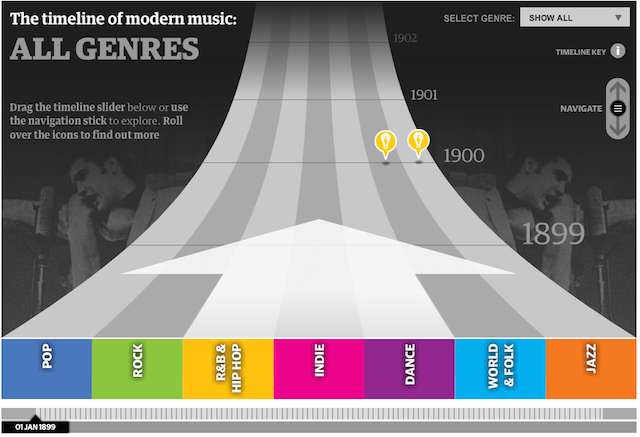
In another example, The Guardian launched their innovative interactive timeline in March 2011 to outline the key milestones and sequence of events related to the Arab Spring.
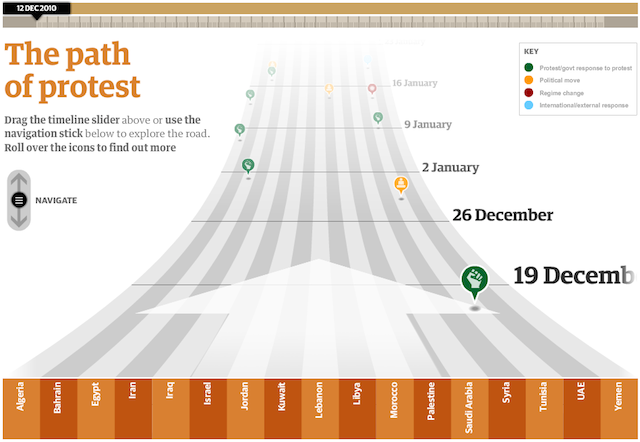
In June of the same year it was re-imagined as a timeline to show the evolution of modern music…
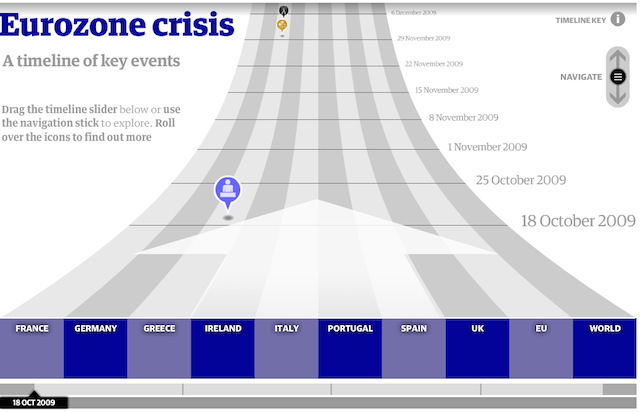
…and again in October 2012 to show the events leading to the Eurozone crisis. An entirely reasonable, appropriate and – importantly – effective choice.
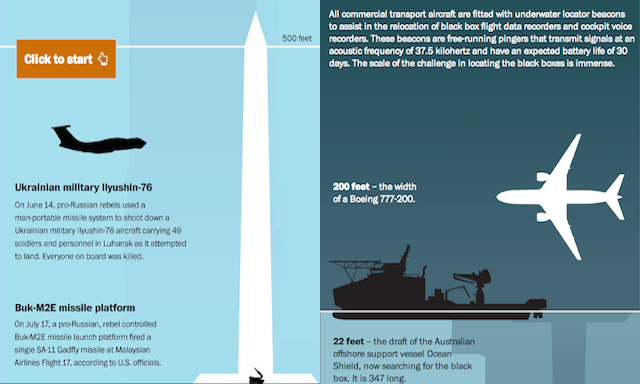
Whilst it is not purely the same archetype being re-used, last week’s ‘How high can a missile reach?‘ graphic published by the Washington Post (by Bonnie Berkowitz, Julie Tate and Richard Johnson) had a more profound effect. This was a vertical-scrollable graphic that aimed to show the scale of the height involved in the tragic shooting down of the Malaysia Flight MH17. I’ve recorded a brief video of it below.
As I mentioned on Twitter last week, there is something so haunting about the juxtaposition of the ‘how high’ graphic considering just three months earlier, the Post produced a ‘how deep’ graphic showing the ‘The depth of the problem‘ (by Richard Johnson and Ben Chartoff). This was a very similar graphic device used to show the scale of the depth involved in the search for the Malaysia Flight MH370 black box.
Once again, the appropriateness of the same graphic approach being used is without question. The switch from height to depth, from upwards scrolling to downwards scrolling, to visually capture the essence of two so-closely-linked tragedies was very cleverly conceived and had a big impact on me.