
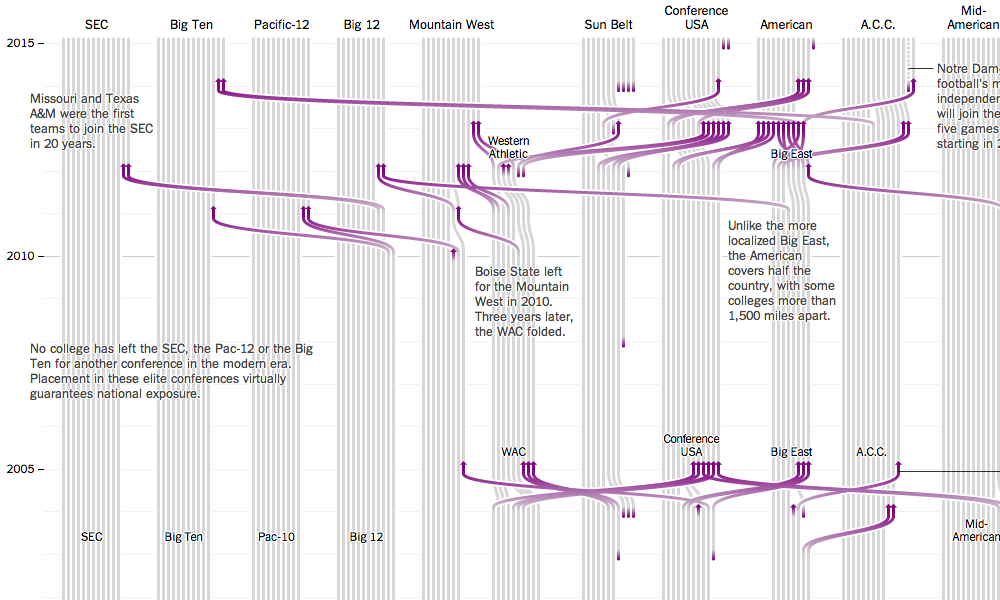
Just been looking in detail at the latest great project from the NYT’s ‘BosCarQue’ triumvirate, visualising the history of college athletics in the US.
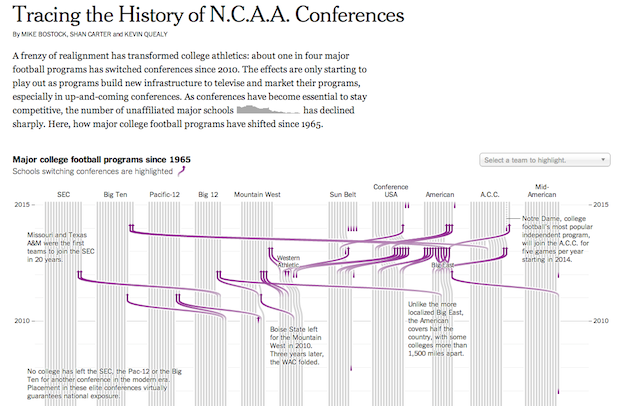
One of the elements that really grabbed me was the integration of a mini bar chart (sparkbars?) within the introduction text.
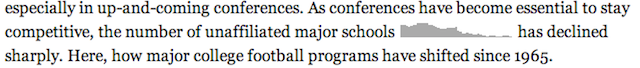
The idea of creating and embedding word-sized graphics into text is not new. Sparklines, as described below, are one of the most enduring ideas from Tufte’s heyday:
A sparkline is a small intense, simple, word-sized graphic with typographic resolution. Sparklines mean that graphics are no longer cartoonish special occasions with captions and boxes, but rather sparkline graphic can be everywhere a word or number can be: embedded in a sentence, table, headline, map, spreadsheet, graphic. From Edward Tufte’s book Beautiful Evidence.
However, this is the first time I recall seeing it being used ‘in the wild’ (ie. not from Tufte’s texts) and done in a way that seemed so natural, so obvious and so seamlessly, as if a bar chart was just another component of our written vocabulary.