
In my most recent ‘10 most significant blah blah blah‘ posts at the end of last year I included (at number 8) examples of where designers were going beyond solely the visual representation of data. Some of these examples included Moritz’ Data Cuisine Workshop, experiments like Tasty Tweets and fun pieces like Pumpkin Pie Charts.
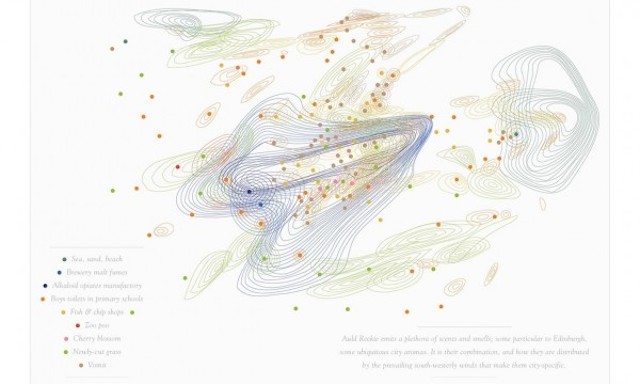
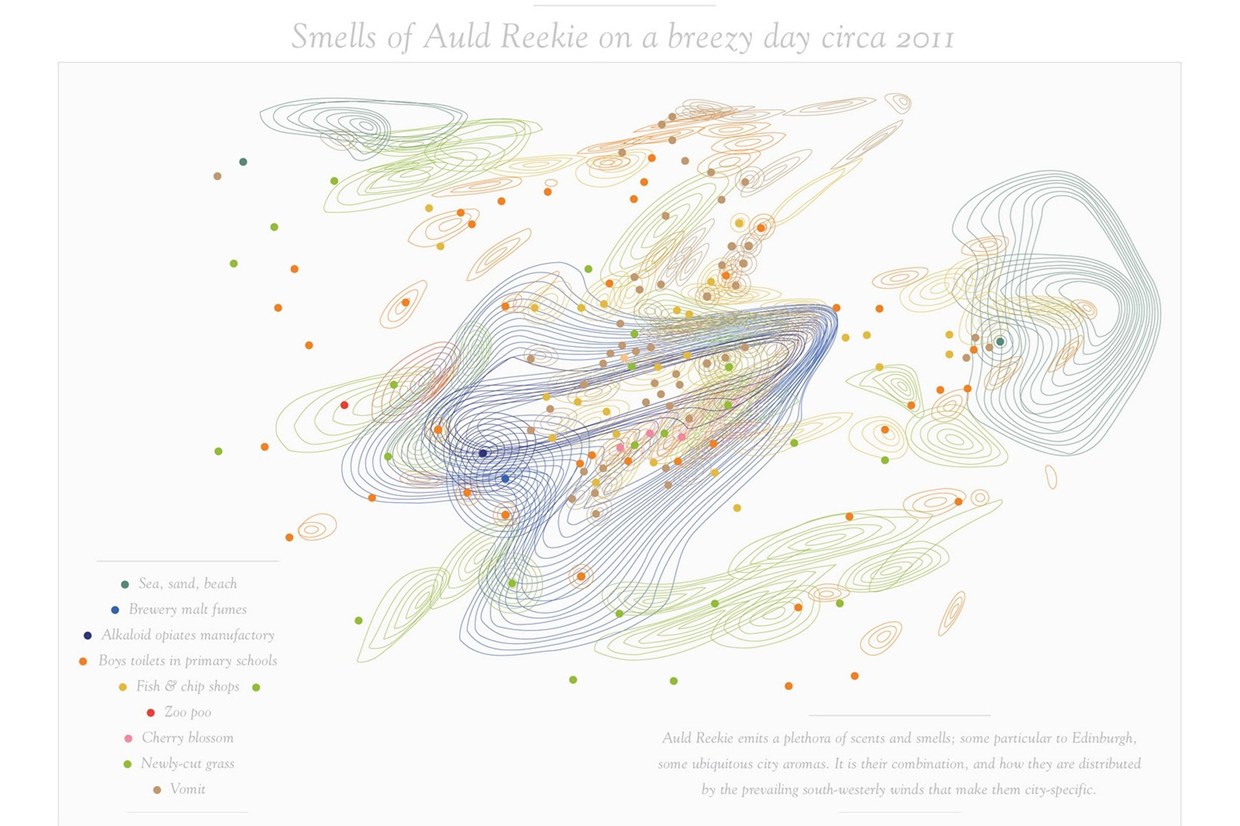
One collection of projects that most intrigued me came from the work of Kate McLean and her fascinating sensory maps: mapping the smells, sounds and tastes of a city. Here is an example of a wonderfully-titled project ‘Auld Reekie‘ showing the smell patterns of Edinburgh.
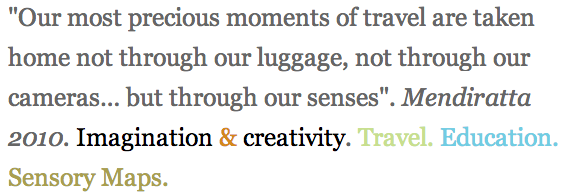
Kate is a designer, photographer and a lecturer, and describes herself as a ‘sensory researcher’ producing work that “challenges the paradigm that graphic design can rely on the visual. We have 5 senses… let’s use them“. I love the quote below, welcoming visitors to Kate’s homepage, as it perfectly captures the incredibly evocative and enduring memories we can create from our non-visual senses.
There are so many dimensions to Kate’s work. On one level she creates abstract visual representations of cityscapes using shape, contours and colours to encode the smells that characterise different parts of a city.
The cities that seem to provide the most striking experiences are those older, non-homogeneous cities with a varied tapestry of cultures and communities. She has done work on Glasgow, Edinburgh, Newport (RI), Paris and New York, and right now she is working on a smell map project for Amsterdam and has just returned from an exhibition of a 3D Smell Map of Milan.
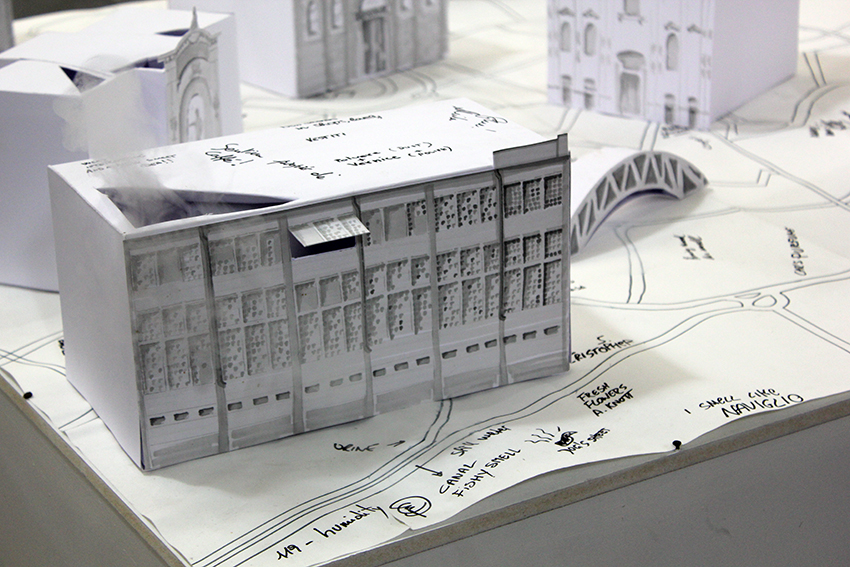
Her process involves undertaking ‘smell walks’ of a city to capture for herself the essence of a city through its aroma. She will then record these experiences forming a ‘smell’ sketch layer of notes on top of a map of the city. From this research Kate will create a visual portrayal of the city, as we see in the image at the top, but she also goes a stage further by making up individual scents using natural ingredients that best reflect the smells identified. These aren’t part of the maps themselves but are incorporated into the wider exhibition, as she describes in an article for the Daily Mail:
Each scent is stored in its own bottle which is stored in a small cabinet underneath the map. I prefer to keep the contents of the bottles hidden so that the audience cannot rely on visual cues to identify the smells. I have learned how to distill rose petals, to create a perfume of stinky cheese, to depict the smell of penguins at the zoo without harming a single penguin. I can fabricate the smell of a building site and of boy’s toilets in primary schools*.
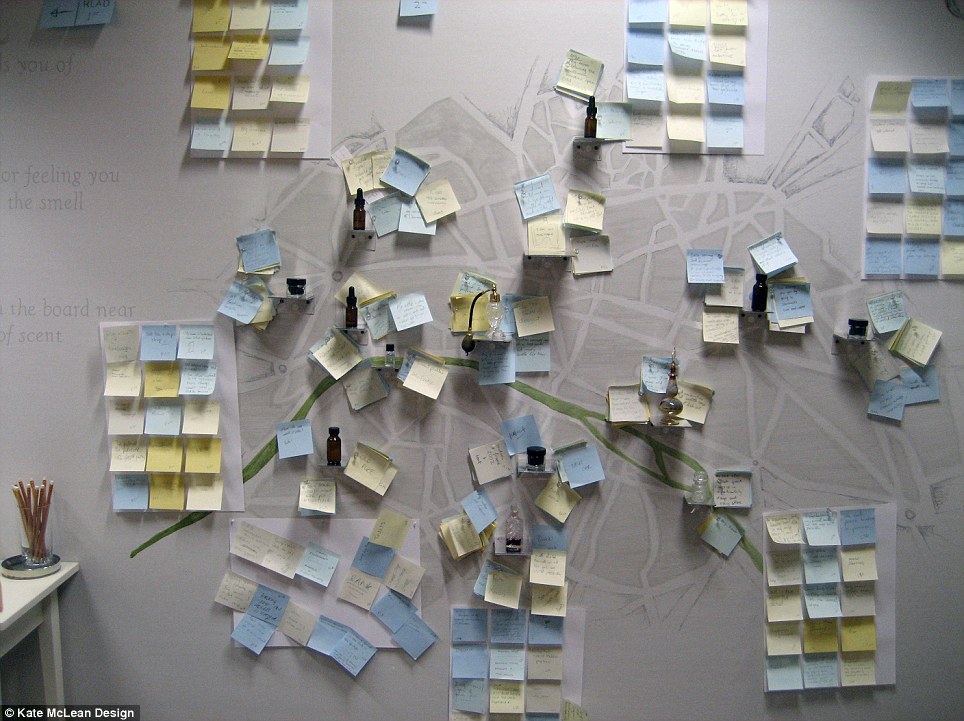
In the image below we see an example of another interactive approach to creating this work, here conducted on a Paris smell map project. Here, the audience were invited to smell a scent, consider their memory or recollection of that smell and then note the feeling they identified with the smell before placing their note on the map in the location they most associated with that smell.
Kate has also worked on a ‘taste map‘ project in Edinburgh using slabs of beef dripping (that eventually melted!) to illustrate the different levels of fat content in typical diets based on (I think) the available cuisine/food outlets around the city. She has also worked on a tactile representation of Edinburgh.

You can keep a track on Kate’s fascination research and design process through her blog and follow her updates on Twitter (@katemclean). For further information, you can listen to Kate chatting about ‘Smell and the City’ (…the lesser known TV series!) on radio in Rhode Island last summer and here is a presentation she gave on ‘Representing Smell‘.
* I think I received that aftershave for Christmas a couple of years ago…