
Thanks to Romain Vuillemot for sharing a really interesting visualization toolkit he has developed with Samuel Huron called Visual Sedimentation (VisualSedimentation.js), a JavaScript library for visualising streaming data, inspired by the process of physical sedimentation.
A static portrayal of this toolkit fails to do the strong design metaphor justice so here is a recording of a recent implementation of this toolkit to visualise the popularity of different colours of M&Ms.
This project runs on actual Twitter data collected over the previous 1 1/2 months starting a couple of days before the Superbowl right up to a current live feed. Romain describes how the idea came about:
I just went to one of those M&M’s store at Time Square and they have those containers everywhere with M&M’s in it 🙂 I guess they fill them every day, but during the day as people serve themselves from the containers, then they become empty and you can see some trends. This is where I got my inspiration and tried to replicate it in the opposite way (by filling up containers instead of emptying them)

What I found most interesting – as Romain observes himself – is how this approach offers a fusion of the bar chart for today’s comparison of colour popularity blended into a streamgraph where the M&M’s count is transposed to be represented by width and the story switches to a continuous stream over time.
This is why our original toolkit on sedimentation is quite useful: we have a running metaphor behind all our design decisions, and we try to be consistent with it. And the result is often very satisfying, as it is smooth and people seem to understand it very well (which makes sense as this is a metaphor and basically surrounds us with mountains, hills, rivers).
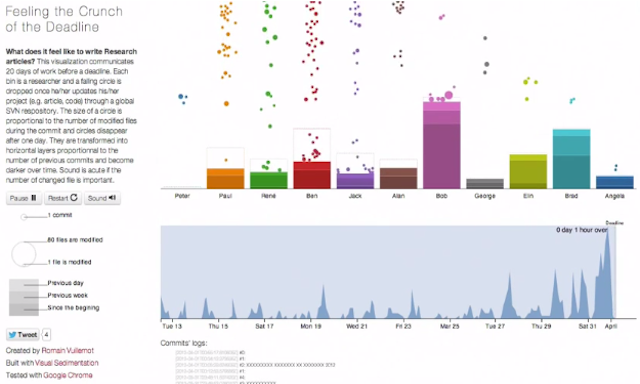
This second project is also really interesting, showing the patterns of how different people progress their work leading up to a deadline. I’m sure we’re all familiar with that last hour rush! Listen to the full version with sound on and you will hear audio representations as an extra layer of the story.