
I’m not always positively struck by social-media related visualisations, however, I do like this Twitter languages map of New York project from James Cheshire, Ed Manley (of CASA) and John Barratt (of Trendsmap) – as well as several others. This follows on from a similar project to look at the patterns of Twitter-based language usage in London, which I had actually forgotten about.
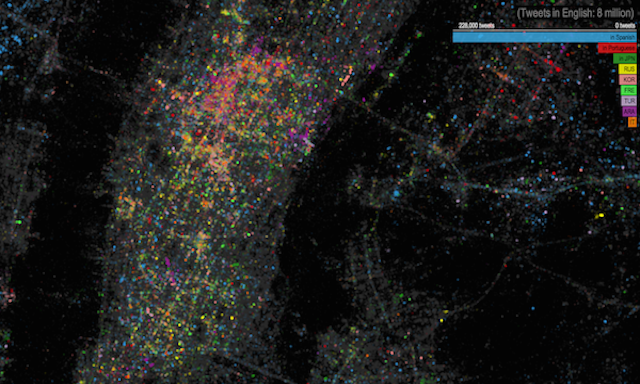
As the title suggests, this project plots the location of tweets and differentiates, through a range of semi-transparent colour, the top ten languages found in these tweets (using Google translation tools to detect the language). The dataset used was a 8.5M large selection of geo-located tweets between Jan 2010 and Feb 2013.
With English clearly being the most popular I like how they have reduced the visibility and prominence of this largest sub-set of data by using grey to help us focus in on the remaining language prevalence. I also like the imposed limitation of just showing the top 10 languages – otherwise the extra language/categorical colour requirements would soon exceed the limit of our eye’s capabilities for distinguishing colour easily.
In terms of headline findings, here’s James’s brief analysis of some of the key patterns:
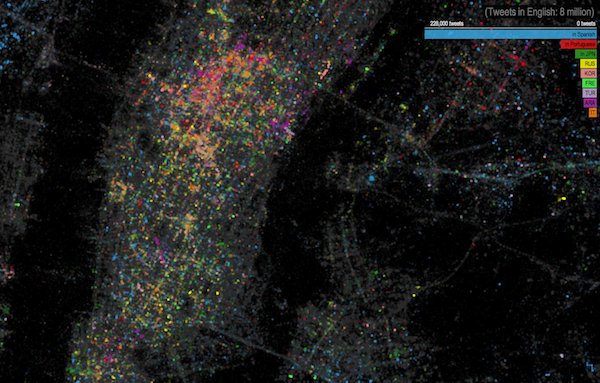
…Spanish (in blue) takes the top spot amongst the other language groups. Portuguese and Japanese take third and fourth respectively. Midtown Manhattan and JFK International Airport have, perhaps unsurprisingly, the most linguistically diverse tweets whilst specific languages shine through in places such as Brighton Beach (Russian), the Bronx (Spanish) and towards Newark (Portuguese). You can also spot international clusters on Liberty Island and Ellis Island and if you look carefully the tracks of ferry boats between them.
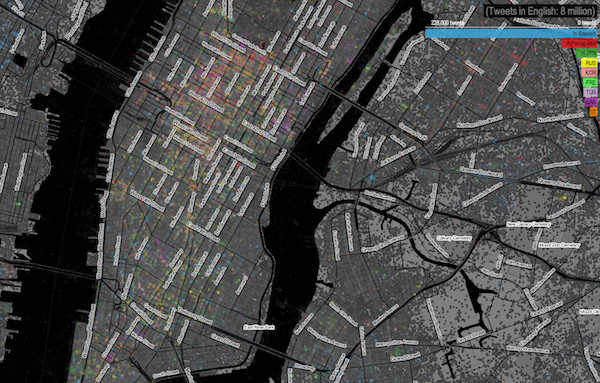
You can modify the view by zooming in/out and panning across the city region. You can also dim/reveal the road markings to get a more accurate sense of the geographical locations.
Ed has provided a more in-depth analysis of the data and James has provided more details of the project as well as alternative views of the data.