
How many of you have heard of the Parsons Journal for Information Mapping (PJIM)? It’s a really good digital publication that comes out quarterly and covers data visualisation with articles on both the theoretical side as well as the practical, highlighting new developments, techniques and great projects from around the field.
PJIM publishes original essays, academic manuscripts, interactive and non-interactive projects, and project documentation. Our goal—shared by those submitting to the publication—is to disseminate knowledge on the theories and applications of information mapping, design, and visualization.
![]()
So far there have been 4 volumes (2009-2012) with 4 publications per year. Across this period there have been 63 articles, so plenty for anyone to get their teeth in to. And its a freely accessible resource, not locked behind publishers pay walls.
In this quarter’s edition:
(1) The Diagram of Information Visualization, by Gaia Scagnetti, about a installation project which looks at the evolution of the field over the past 5-10 years and creates a time line of some of the most influential events and developments.

(2) Trends in Olympic Pictograph Design: A comparative study using Olympic Games’ Sports Symbols, by SoJung Kim, which describes a project about the evolution of designs used to represent different sporting events at the Olympics down the years.

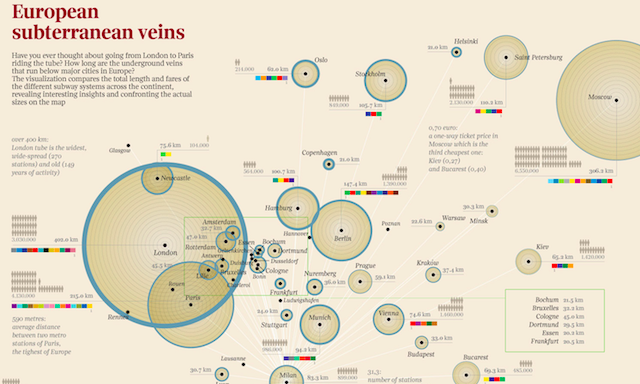
(3) Non-linear Storytelling: Journalism through “Info-spatial” Compositions, by Giorgia Lupi, which analyses the work she and her colleagues at Accurat have been doing for the weekly visual data section of La Lettura in the Corriere della Sera Italian newspaper.

I highly recommend you subscribe to the quarterly publication visit here and if you want to contribute an article you can find out more here.