Whilst working on my book this afternoon a thought struck me: When, where and by whom was the term ‘data visualization’ or ‘information visualization’ (give or take an S or a Z) used?
Was it Tufte? Was it Bertin? Tukey, perhaps? Surely it wasn’t Florence Nightingale or William Playfair? It feels like one of the facts that you should know and is probably something that you don’t want to admit not knowing. Well, allow me to put my hands up and admit I don’t know the answer.
So, in order to pursue this fascinating (my word, you don’t need to agree) journey of discovery, this will be an evolving blog post to try and track down the first use of the term ‘data visualization‘ or ‘information visualization‘. It might be rapidly solved, it might go on for years, either way just enjoy the ride folks…
Google Ngram
Let’s start off with Google Ngram Viewer (nice reminder/tip from Michael Babwahsingh).
“When you enter phrases into the Google Books Ngram Viewer, it displays a graph showing how those phrases have occurred in a corpus of books (e.g., “British English”, “English Fiction”, “French”) over the selected years.”
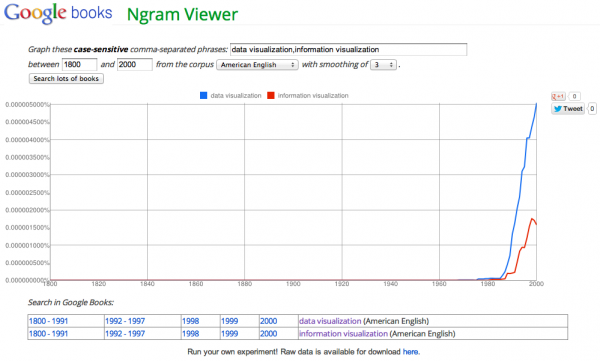
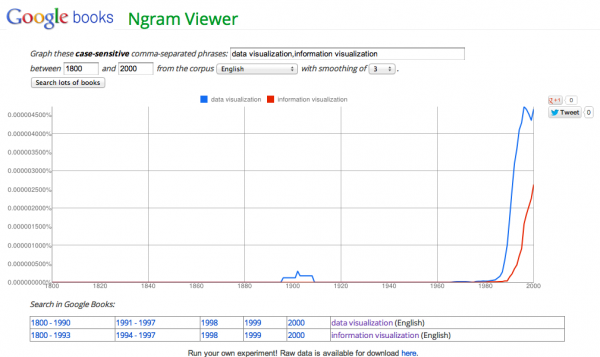
This first search suggests the first usage would have been around the start of the 90’s. But if we then revisit the same search but rather than American English we just use English, we get an interesting little peak around 1900??
Earliest reference in books?
1999?
Interestingly, whilst its a relatively new book (1999), Readings in Information Visualization by Stuart K. Card, Jock D. Mackinlay, Ben Shneiderman comes attached with this abstract and refers to the ‘emerging‘ field:
“This groundbreaking book defines the emerging field of information visualization and offers the first-ever collection of the classic papers of the discipline, with introductions and analytical discussions of each topic and paper.”
1963?
**Update** The date of publication for this is wrong, given that the contents describes the 70s, 80s and beyond. Hard to do if you’re writing it in 1963…
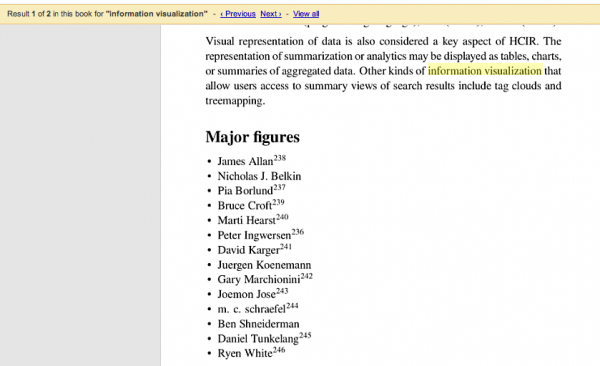
Information Retrieval: Ground Rules for Indexing, by Information Retrieval Project, University of Dayton Research Institute contains a reference on page 78 about Information Visualization… (For what it’s worth, my money is going on Ben Schneiderman)
1993
Next up is an obvious one (on so many levels), William Cleveland’s Visualizing Data from 1993.
1984? 1985?
If Cleveland’s book of 1993 was using the term data visualization, then maybe one of the founding papers on which this book was based will also show it being used?
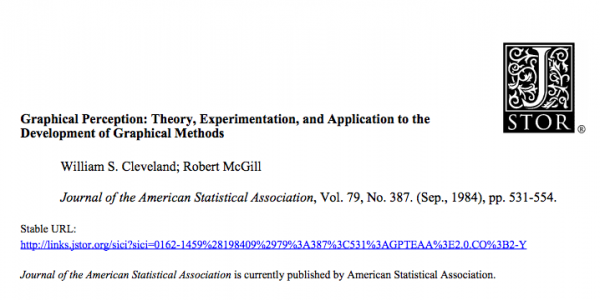
Cleveland and Robert McGill’s paper ‘Graphical Perception: Theory, Experimentation, and Application to the Development of Graphical Methods’ is one of the most important written on this subject. Published in the ‘Journal of the American Statistical Association’ in September 1984 (Full ref: Vol. 79, No. 387. (Sep., 1984), pp. 531-554).
Unfortunately the pdf’s are all scanned so word searches are out of the question, it will have to be a visual trawl…
Initial inspection does not find the term used which is interesting: graphical perception and graphical communication are prominent but not visualization as yet. So what influenced Cleveland to entitle his book 9 years later ‘Visualizing Data’?
It certainly wasn’t the paper Cleveland and McGill published in the following year (August 1985) titled ‘Graphical Perception and Graphical Methods for Analyzing Scientific Data‘.
Other authors?
Searching through further papers by Howard Wainer, Kosslyn, Spence – draws another blank. The terms associated with these authors and papers leads to alternative phrases like data analysis, graphical perception (again), graphical discrimination, visual perception and graphical analysis. This leads me to believe that neither Bertin nor Tukey would have used the terms otherwise they would be heavily referenced.
1991?
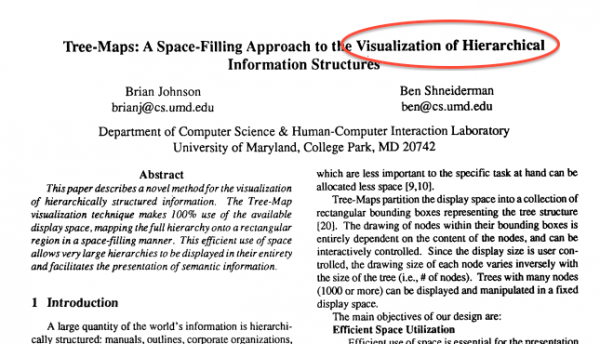
Maybe my scent was on to something… Johnson B and Shneiderman B (1991), “Tree-maps: a space-filling approach to the visualization of hierarchical information structures”, In Proceedings of IEEE Conference on Visualization., Oct., 1991. , pp. 284-291.
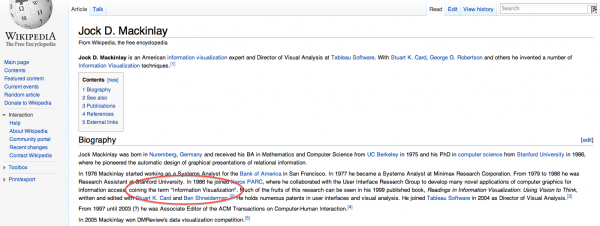
… but also we have Jock MacKinlay emerging prominently. In 1991 he, Stuart Card and George Robertson published a paper entitled Cone Trees: animated 3D visualizations of hierarchical information.
A further search for Jock leads me to Robert Kosara’s article about his influences and this gets interesting. I then follow my nose and find this Wikipedia entry with a rather interesting line in it…
At this stage, I’m declaring Jock MacKinlay the originator of the term ‘Information Visualization’ (and he is therefore the treasure at the end of this quest) unless anyone can find compelling alternative evidence!
1987?
Hold the back pages! Ben Jones from dataremixed.com has unearthed a nice discovery.
The earliest publication of the phrase “data visualization” that I was able to find was from a 1987 publication of the U.S. National Research Council called “Space Technology to Meet Future Needs”. Ironically, the place where the term is used (Page 111, Chapter 11) deals with technology research needs to support “deep space flights of long duration (for example, a Mars mission)”. Here is the link.. The quote is “Ground-based data analysis: Needs for ground-based data analysis include cost-effective high-capability work stations, data visualization, and automation of analysis tools and techniques.”
Any advances on 1987?

