
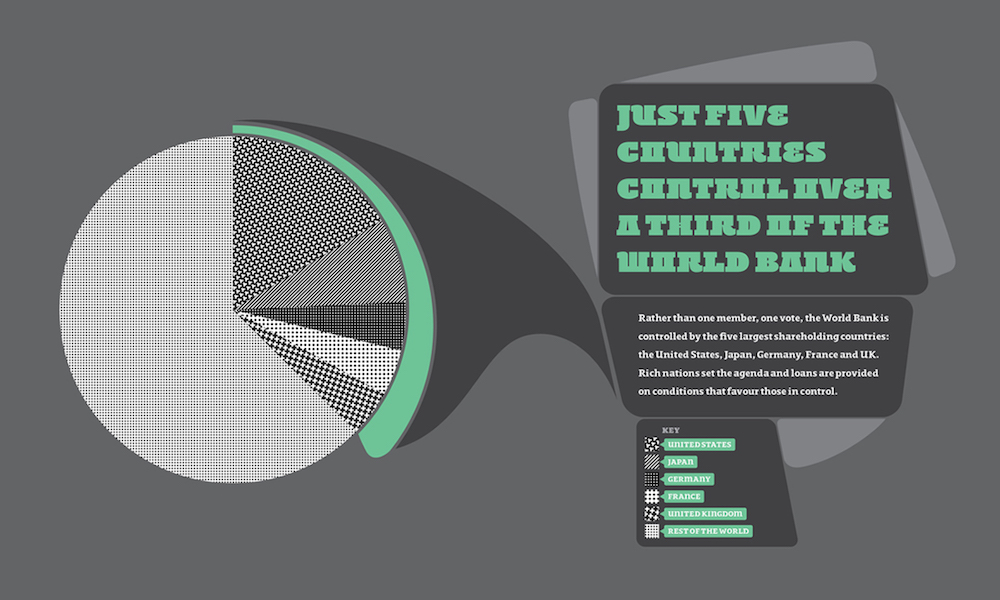
Yesterday, I came across a graphic which I believe to be possibly the worst graph I have ever seen. I’ve seen some stinkers but this has cleared out the room. Now hold your nose…

It comes from a book titled “The Little Book of Shocking Global Facts“. I’m sure I won’t be the first to offer it the alternate title of “Little Book of Shocking Graphs”. Interestingly the tag line on this article describes it as a “new book of astounding charts and stats” which does work on an unintended level.
Accompanying this are many other examples of bad practice in visualisation design – the fundamental purpose of which, let’s remember, is to effectively communicate information about a subject.


It is almost impossible to know where to start in critiquing a design like, so many are its faults. At best they are bad album art.
I discussed in a previous post how it is important to maintain balance and consideration when commenting on the work of designers trying to produce visualisation designs – often they contain flaws but have good intent. This is not one of them. Furthermore, the purpose and intention behind this book, which is to inform and engage people about significant and important global issues, deserves so much more than what has been produced. I think it is somewhat irresponsible of the publishers to have commissioned or approved the work that has been delivered here.
[Edit: coincidentally I’ve just seen that Andrew at Infosthetics has also published a post about this topic, as has Nicholas Felton]