
Very disappointed in Tableau for the production of this graph on their most recent blog post. I’m a big fan of their software and their credible stance on principles relating to data visualisation but, on this occasion, they’ve produced something which breaks a number of their championed best practices.
The graph displayed relates to the results of a Gartner customer survey and presents how customers are using various BI platforms.

The accompanying narrative is as follows:
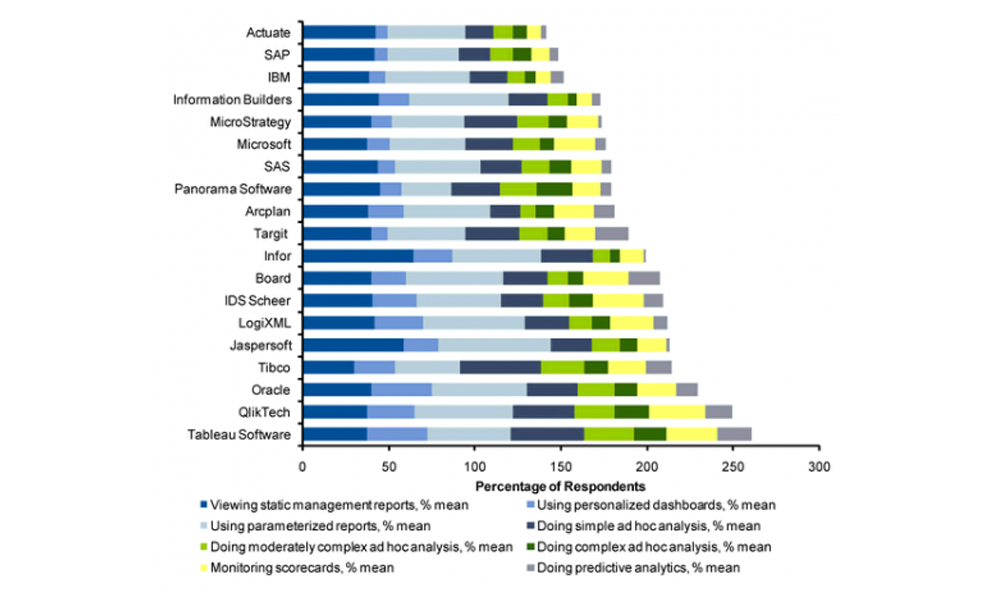
In the graph above, we’re seeing the percent of customers using the product for one of eight different BI activities. Each stacked bar represents the summation of those. Since one customer can use a product for multiple functions, the stacked bar reaches well over 100%.
It would appear that for each of the eight categories of BI activity respondents gave a yes or no reply depending on whether they use the software for that purpose or not. So for each activity the potential highest value would be 100% usage.
Tableau are therefore trying to show how versatile their software is by revealing the high usage percentages against the categories as an aggregate, however, this is not an effective way to present the information. The value axis labelled ‘percentage of respondents’ goes way beyond 100% reaching about 260% which typifies the confusion the reader has trying to interpret the graph.
I haven’t got the raw numbers to usefully create a redesign but a more effective way to present this (and incidentally a method which is fundamental to the functionality of Tableau) would be through small multiples, perhaps with Tableau’s values highlighted. A summary graph could then be plotted revealing the mean percentages across all eight categories which would reveal tableau as having the highest value, thus achieving the apparent aim of this graph.