
Delighted that Elissa Fink, VP Marketing at Tableau Software, has taken the time to comment on my recent post ‘Tableau graph showing Gartner’s customer survey results‘ to provide some important context and explanation behind the use of this graph in their recent blog item.

Elissa comments as follows:
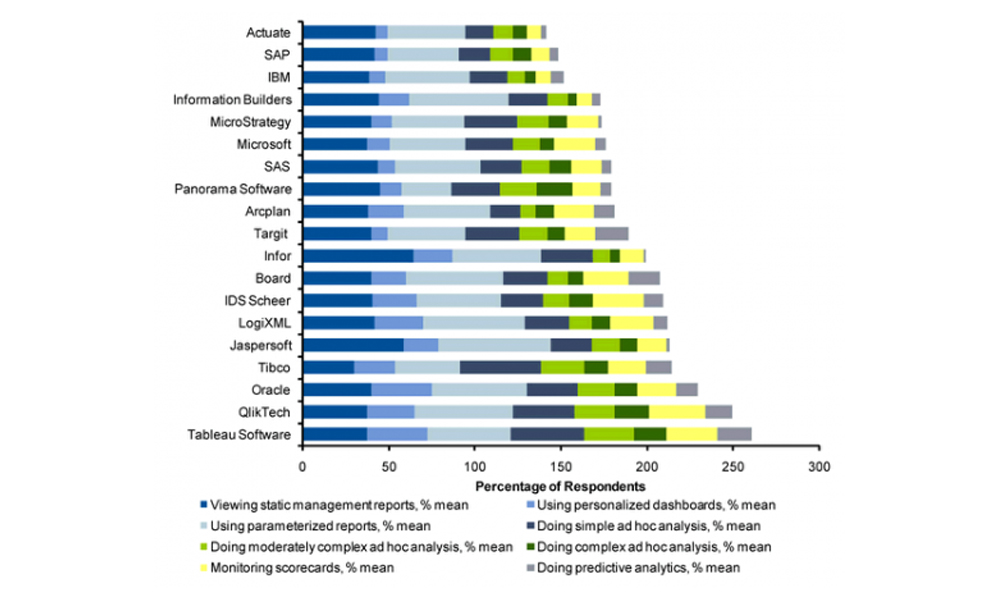
Thanks for noticing our blog post. The graph was not created by Tableau – it’s Gartner’s graph. I should have made it more obvious that the graph was not ours (and because of your comment, I’ll make that change on the post). Gartner does not release the raw data and only allows people to show their original graphics. So all we could do was show their graph. I should have cited them as the maker of the graph; we know that there are better ways to show that data. Thanks again for noticing our post! Best, Elissa Fink
Many thanks to Elissa for clearing this up and, as a fan of the software, glad to hear that it isn’t one of their own!